
Introduction to the Quantitative Analysis Menu
Quantitative analysis (QA) in finance is an approach that emphasizes mathematical and statistical analysis to help determine the value of a financial asset, such as a stock or option. The ultimate goal of financial quantitative analysis is to use quantifiable statistics and metrics to assist investors in making profitable investment decisions. Quantitative analysis is different from qualitative analysis, which looks at factors such as how companies are structured, the makeup of their management teams, and what their strengths and weaknesses are.
The Quantitative Analysis menu is a common menu to three asset classes:
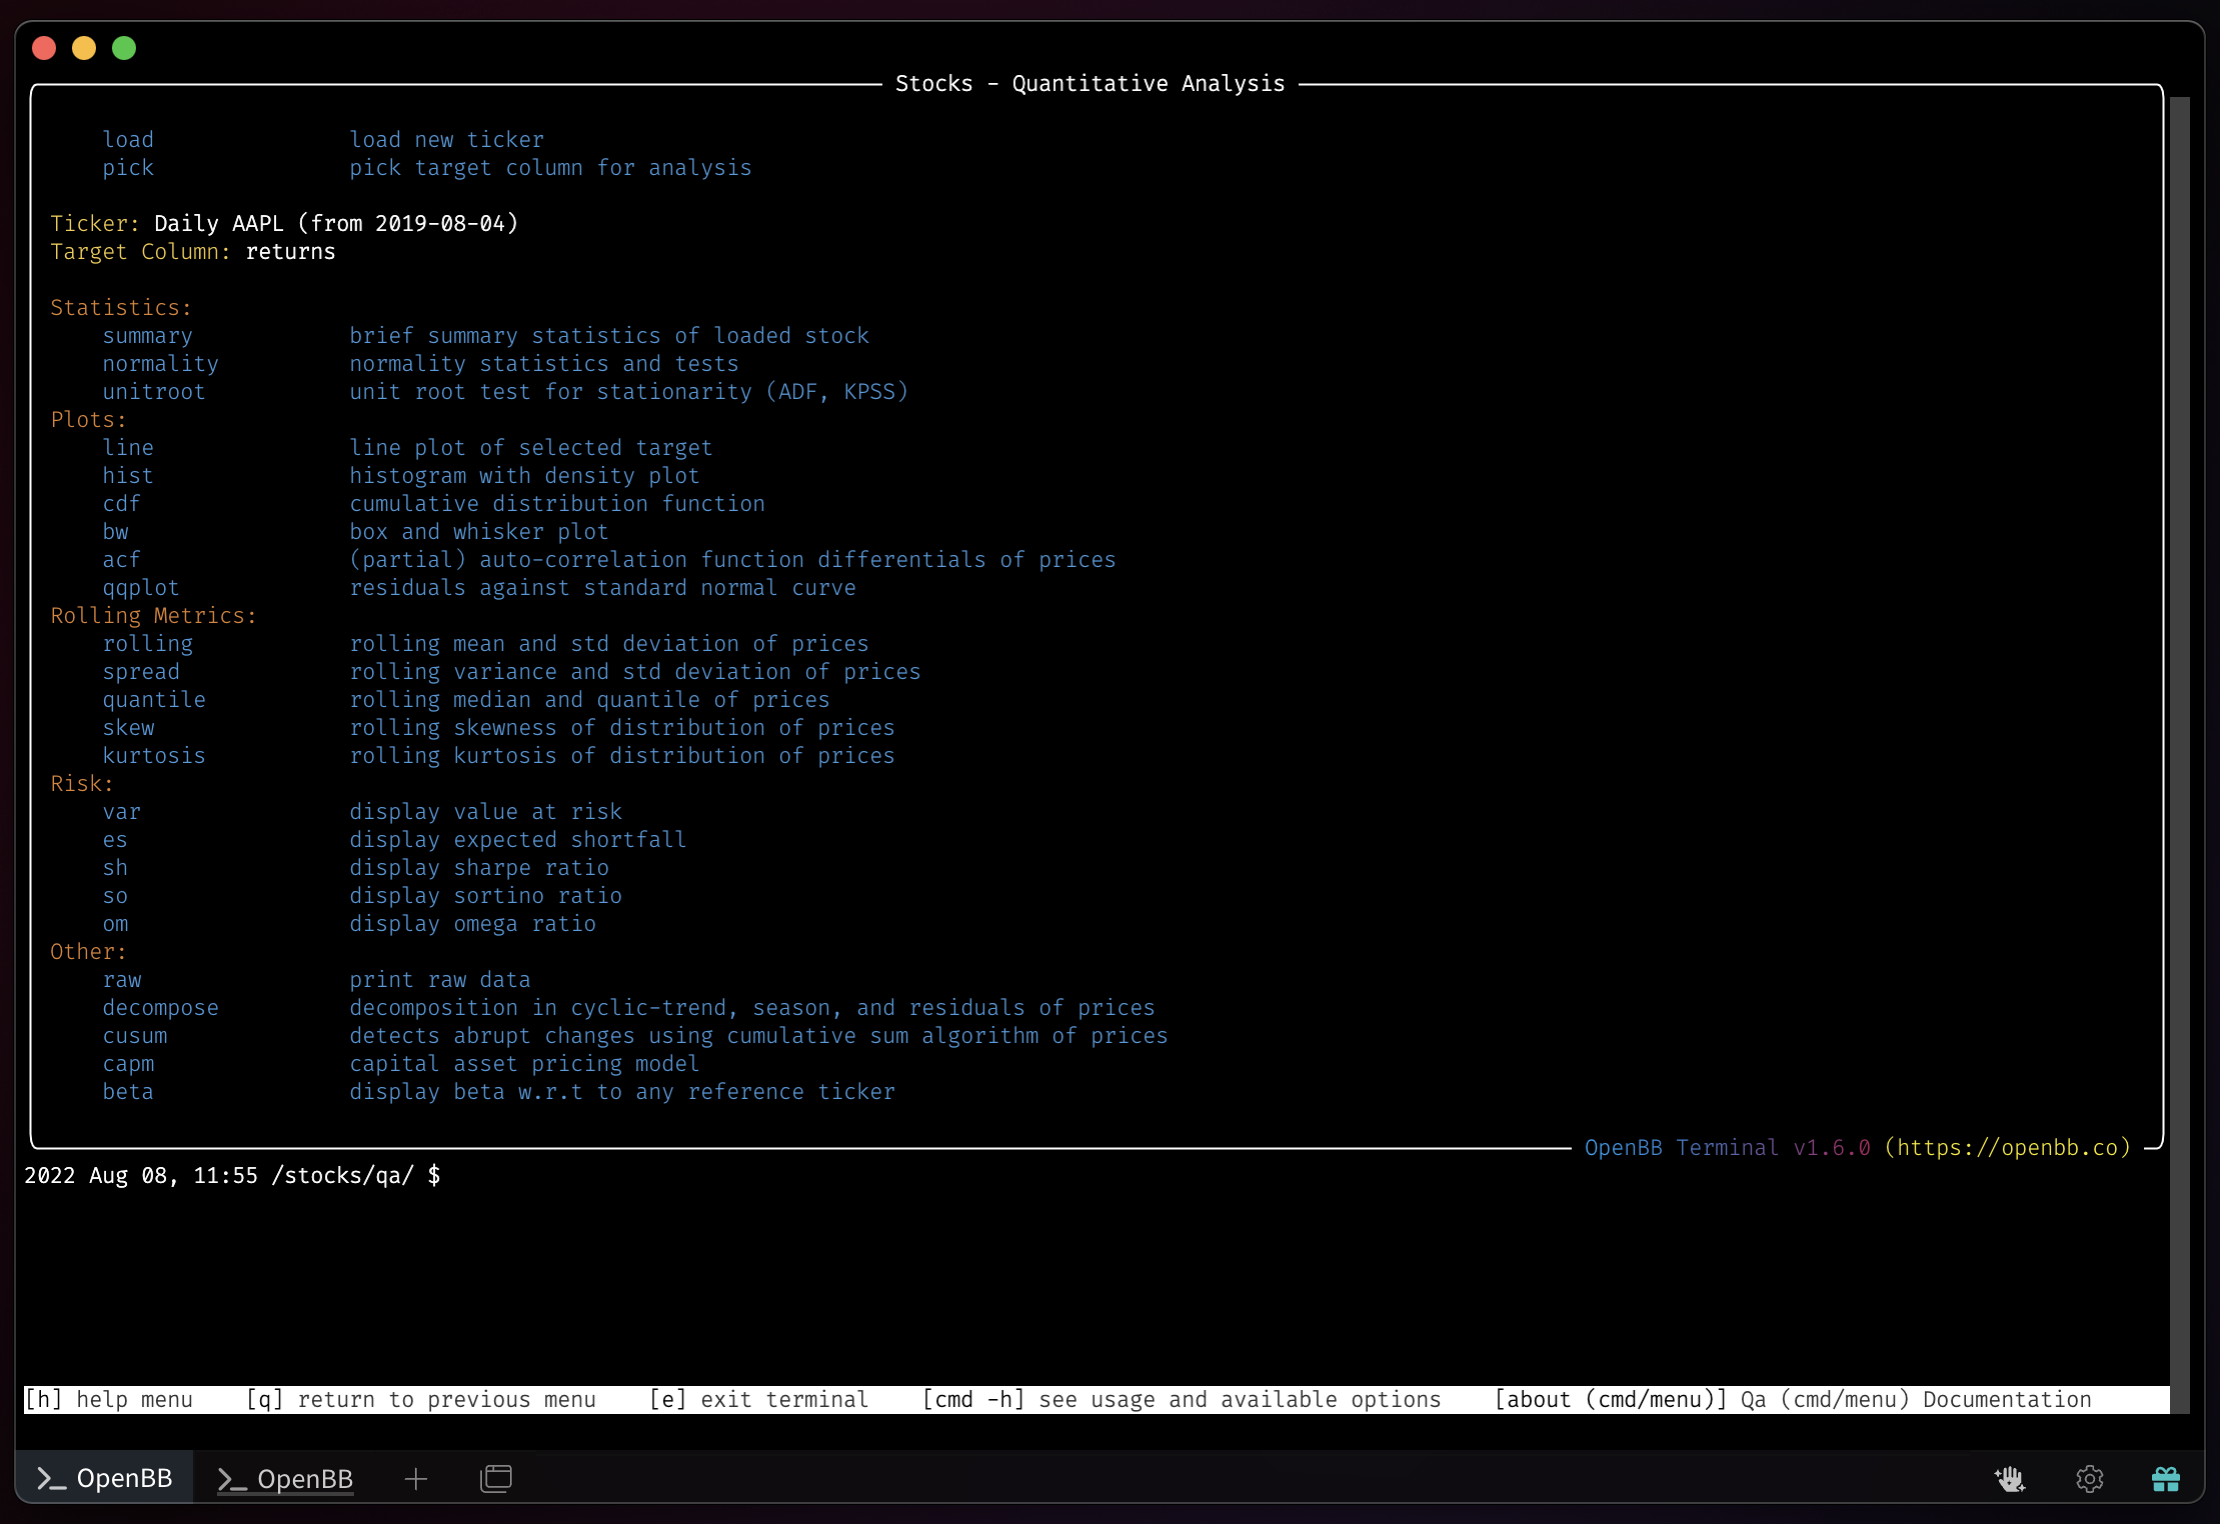
How to use the Quantitative Analysis Menu
Enter the menu, through one of the asset classes listed above, by entering qa in the Terminal. The ticker that is loaded before entering the menu will determine the timeframe for the analysis. To alter it, use the load function and pick a new --start and --end for the observation window. The QA functions target a specified column of the data. By default, this is returns. Use the pick command to chose a new target column.

The menu is divided into five categories of functions:
- Statistics
- Plots
- Rolling Metrics
- Risk
- Other
A summary of exportable statistics is displayed with the command, summary. The example here shows $APPL.

A simple line chart for the target column as a time-series is called with the line command.

Optional arguments to this command allows the user to draw and annotate on the chart.
2022 Aug 08, 12:14 /stocks/qa/ $ line -h
usage: line [--log] [-d] [--ml ML] [--ms MS] [-h] [--export EXPORT]

Show line plot of selected data and allow to draw lines or highlight specific datetimes.

options:
  --log            Plot with y on log scale (default: False)
  -d, --draw       Draw lines and annotate on the plot (default: False)
  --ml ML          Draw vertical line markers to highlight certain events (default: )
  --ms MS          Draw scatter markers to highlight certain events (default: )
  -h, --help       show this help message (default: False)
  --export EXPORT  Export figure into png, jpg, pdf, svg (default: )

For more information and examples, use 'about line' to access the related guide.

2022 Aug 08, 12:20 /stocks/qa/ $ pick high

2022 Aug 08, 12:20 /stocks/qa/ $ line --draw
Click twice for annotation.
Close window to keep using terminal.

Annotation: Lower Highs

Compare the beta between the loaded asset and another, using the -r flag to deviate from the defaulted comparison, $SPY.
2022 Aug 08, 12:34 /stocks/qa/ $ beta -r MSFT

Loading Daily MSFT stock with starting period 2019-08-05 for analysis.
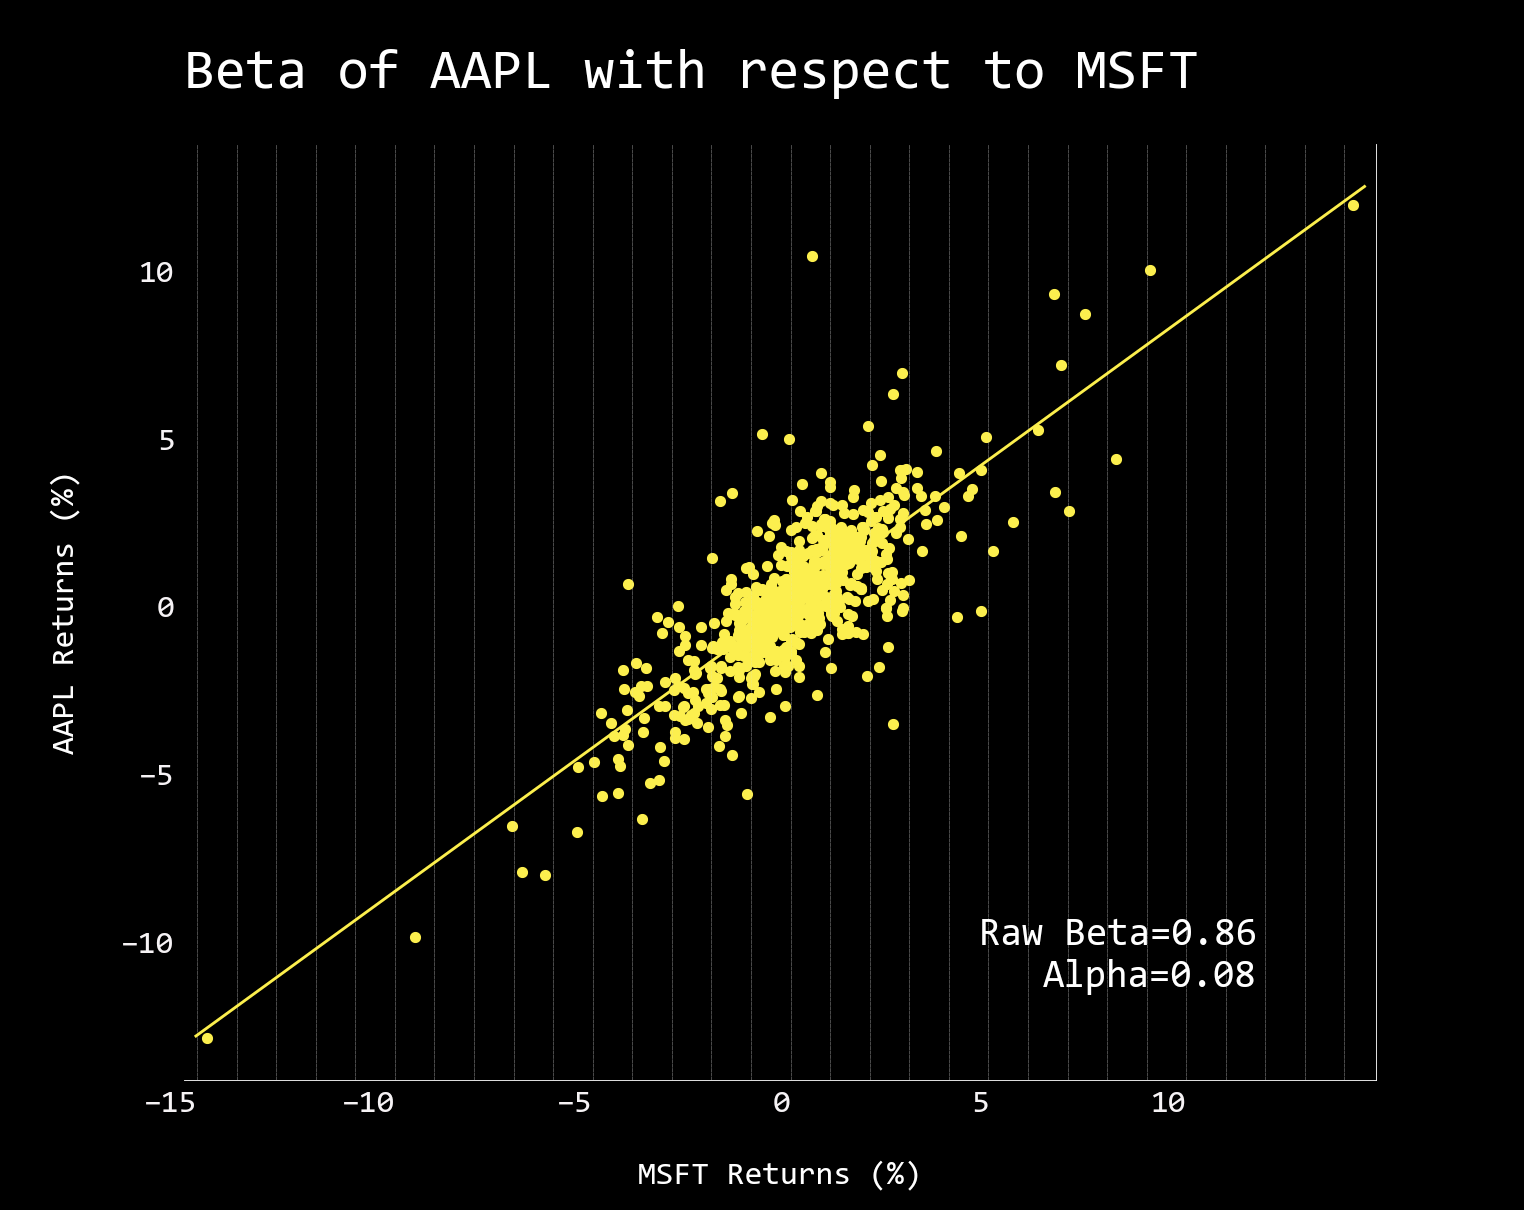
Most outputs are equipped with an --export flag, allowing the user to save the tables as a CSV, JSON, or XLSX file. The exports can then be imported into other menus like Econometrics. Additional information on each specific command is displayed by attaching -h to it.
Examples
Box and Whisker plots for monthly and yearly scales:
2022 Aug 08, 12:47 /stocks/qa/ $ bw

2022 Aug 08, 12:47 /stocks/qa/ $ bw -y

Pick logret for rate of change to the returns of the asset:
2022 Aug 08, 12:47 /stocks/qa/ $ pick logret

2022 Aug 08, 12:51 /stocks/qa/ $ bw -y

decompose shows a visual representation of trend and seasonality.

skew shows the asymmetric distribution over a specified window (default of 14).

skew -w 5 Changing the window to five takes out some of the smoothness:

Sharpe Ratio over time, sh:

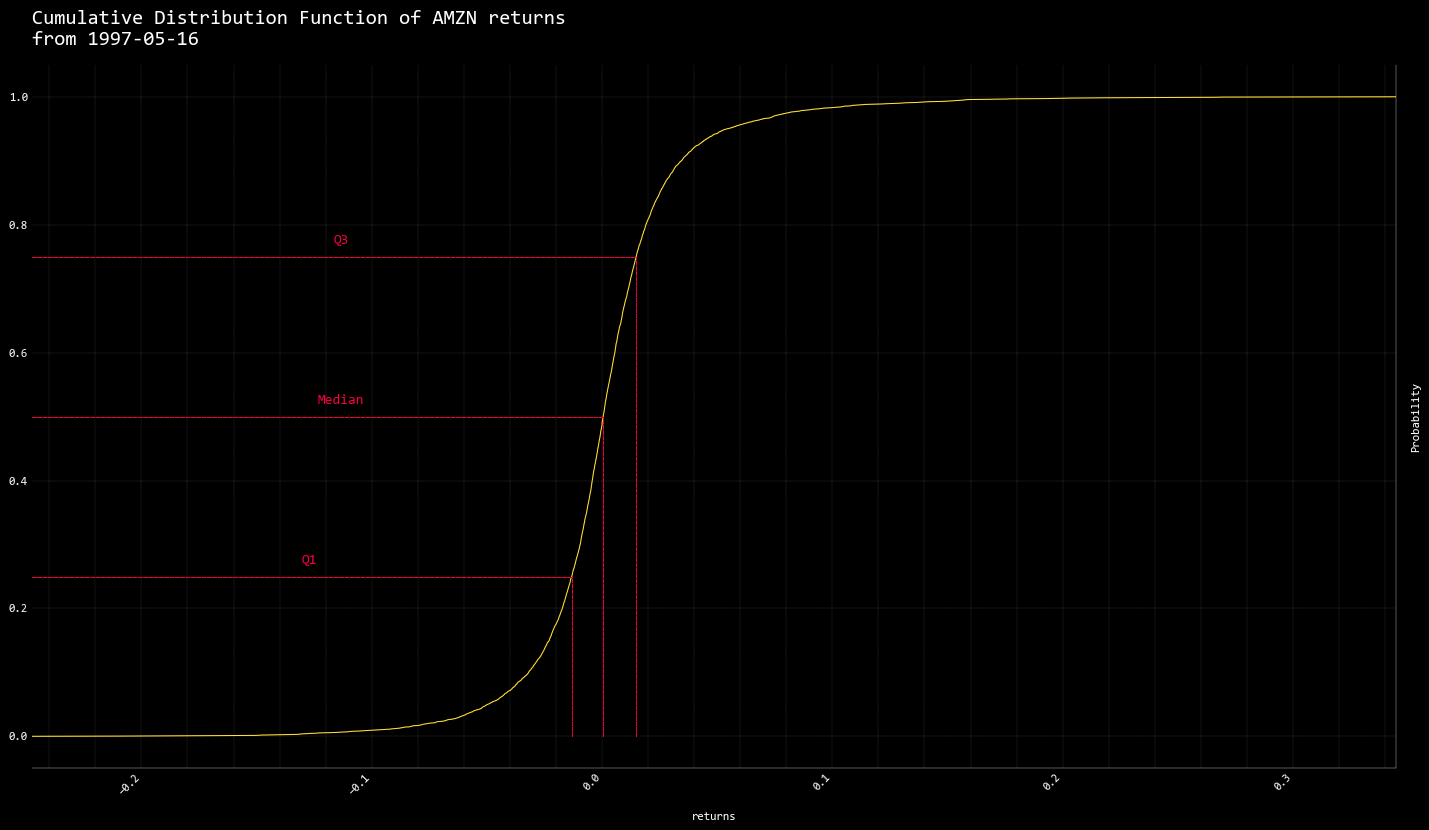
cdf calls the cumulative distribution function. Apple over the long term exhibits a steep curve.

Compared with Apple, Amazon is a more gently sloping s-curve.
capm shows the stock’s risk against the market’s. $AAPL carries the risk of whatever happens to the markets, happens to the stock.
2022 Aug 08, 13:51 /stocks/qa/ $ capm
Beta:                   1.15
Systematic Risk:        46.40%
Unsystematic Risk:      53.60%
Read more about this subject on Wikipedia: https://en.wikipedia.org/wiki/Quantitative_analysis_(finance)
Back to the Getting Started Guide