Plot
usage: plot
            [-c {OPTIONS}]
            [-h] [--export {png,jpg,pdf,svg}]
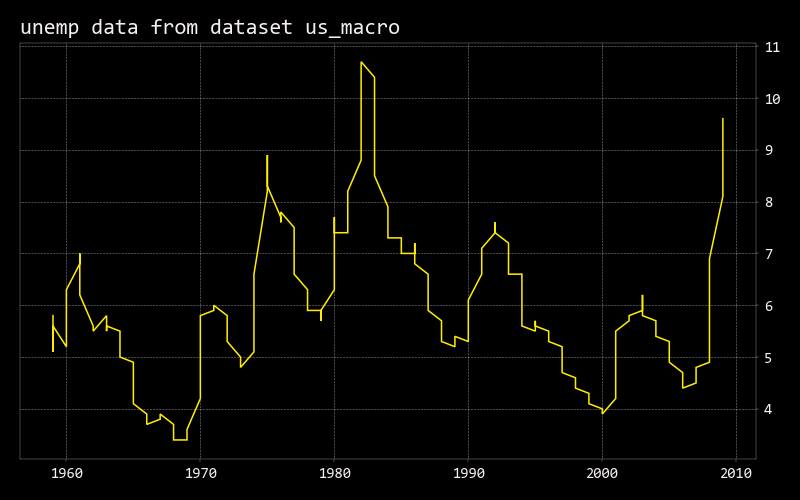
Plot data based on the index. This functionality does not work for Panel Data unless creating a subset of the data that has only a singular index.
optional arguments:
  -c {OPTIONS} --column {OPTIONS}
                        Column to plot along the index (default: None)
  -h, --help            show this help message (default: False)
  --export {png,jpg,pdf,svg}
                        Export figure into png, jpg, pdf, svg (default: )
Example:
2022 Feb 28, 04:37 (✨) /econometrics/ $ load macrodata us_macro

2022 Feb 28, 04:38 (✨) /econometrics/ $ index us_macro year -d

2022 Feb 28, 04:38 (✨) /econometrics/ $ show us_macro
                                                               us_macro
┏━━━━━━━━┳━━━━━━━━━┳━━━━━━━━━┳━━━━━━━━━━┳━━━━━━━━━┳━━━━━━━━━━┳━━━━━━━━━┳━━━━━━━┳━━━━━━━━┳━━━━━━━━━━┳━━━━━━━┳━━━━━━━━┳━━━━━━━┳━━━━━━━━━┓
┃        ┃ quarter ┃ realgdp ┃ realcons ┃ realinv ┃ realgovt ┃ realdpi ┃ cpi   ┃ m1     ┃ tbilrate ┃ unemp ┃ pop    ┃ infl  ┃ realint ┃
┡━━━━━━━━╇━━━━━━━━━╇━━━━━━━━━╇━━━━━━━━━━╇━━━━━━━━━╇━━━━━━━━━━╇━━━━━━━━━╇━━━━━━━╇━━━━━━━━╇━━━━━━━━━━╇━━━━━━━╇━━━━━━━━╇━━━━━━━╇━━━━━━━━━┩
│ 1959.0 │ 1.00    │ 2710.35 │ 1707.40  │ 286.90  │ 470.05   │ 1886.90 │ 28.98 │ 139.70 │ 2.82     │ 5.80  │ 177.15 │ 0.00  │ 0.00    │
├────────┼─────────┼─────────┼──────────┼─────────┼──────────┼─────────┼───────┼────────┼──────────┼───────┼────────┼───────┼─────────┤
│ 1959.0 │ 2.00    │ 2778.80 │ 1733.70  │ 310.86  │ 481.30   │ 1919.70 │ 29.15 │ 141.70 │ 3.08     │ 5.10  │ 177.83 │ 2.34  │ 0.74    │
├────────┼─────────┼─────────┼──────────┼─────────┼──────────┼─────────┼───────┼────────┼──────────┼───────┼────────┼───────┼─────────┤
│ 1959.0 │ 3.00    │ 2775.49 │ 1751.80  │ 289.23  │ 491.26   │ 1916.40 │ 29.35 │ 140.50 │ 3.82     │ 5.30  │ 178.66 │ 2.74  │ 1.09    │
├────────┼─────────┼─────────┼──────────┼─────────┼──────────┼─────────┼───────┼────────┼──────────┼───────┼────────┼───────┼─────────┤
│ 1959.0 │ 4.00    │ 2785.20 │ 1753.70  │ 299.36  │ 484.05   │ 1931.30 │ 29.37 │ 140.00 │ 4.33     │ 5.60  │ 179.39 │ 0.27  │ 4.06    │
├────────┼─────────┼─────────┼──────────┼─────────┼──────────┼─────────┼───────┼────────┼──────────┼───────┼────────┼───────┼─────────┤
│ 1960.0 │ 1.00    │ 2847.70 │ 1770.50  │ 331.72  │ 462.20   │ 1955.50 │ 29.54 │ 139.60 │ 3.50     │ 5.20  │ 180.01 │ 2.31  │ 1.19    │
├────────┼─────────┼─────────┼──────────┼─────────┼──────────┼─────────┼───────┼────────┼──────────┼───────┼────────┼───────┼─────────┤
│ 1960.0 │ 2.00    │ 2834.39 │ 1792.90  │ 298.15  │ 460.40   │ 1966.10 │ 29.55 │ 140.20 │ 2.68     │ 5.20  │ 180.67 │ 0.14  │ 2.55    │
├────────┼─────────┼─────────┼──────────┼─────────┼──────────┼─────────┼───────┼────────┼──────────┼───────┼────────┼───────┼─────────┤
│ 1960.0 │ 3.00    │ 2839.02 │ 1785.80  │ 296.38  │ 474.68   │ 1967.80 │ 29.75 │ 140.90 │ 2.36     │ 5.60  │ 181.53 │ 2.70  │ -0.34   │
├────────┼─────────┼─────────┼──────────┼─────────┼──────────┼─────────┼───────┼────────┼──────────┼───────┼────────┼───────┼─────────┤
│ 1960.0 │ 4.00    │ 2802.62 │ 1788.20  │ 259.76  │ 476.43   │ 1966.60 │ 29.84 │ 141.10 │ 2.29     │ 6.30  │ 182.29 │ 1.21  │ 1.08    │
├────────┼─────────┼─────────┼──────────┼─────────┼──────────┼─────────┼───────┼────────┼──────────┼───────┼────────┼───────┼─────────┤
│ 1961.0 │ 1.00    │ 2819.26 │ 1787.70  │ 266.40  │ 475.85   │ 1984.50 │ 29.81 │ 142.10 │ 2.37     │ 6.80  │ 182.99 │ -0.40 │ 2.77    │
├────────┼─────────┼─────────┼──────────┼─────────┼──────────┼─────────┼───────┼────────┼──────────┼───────┼────────┼───────┼─────────┤
│ 1961.0 │ 2.00    │ 2872.01 │ 1814.30  │ 286.25  │ 480.33   │ 2014.40 │ 29.92 │ 142.90 │ 2.29     │ 7.00  │ 183.69 │ 1.47  │ 0.81    │
└────────┴─────────┴─────────┴──────────┴─────────┴──────────┴─────────┴───────┴────────┴──────────┴───────┴────────┴───────┴─────────┘

2022 Feb 28, 04:38 (✨) /econometrics/ $ plot unemp-us_macro