---
title: Chart from raw data
sidebar_position: 1
description: Learn how to transform raw data into informative charts using OpenBB
Terminal Pro. This tool simplifies data visualization, aiding quants and analysts
in their investment research.
keywords:
- investment research
- data visualization
- charting tool
- quants
- analysts
---
import HeadTitle from '@site/src/components/General/HeadTitle.tsx';
import TutorialVideo from '@site/src/components/General/TutorialVideo.tsx';
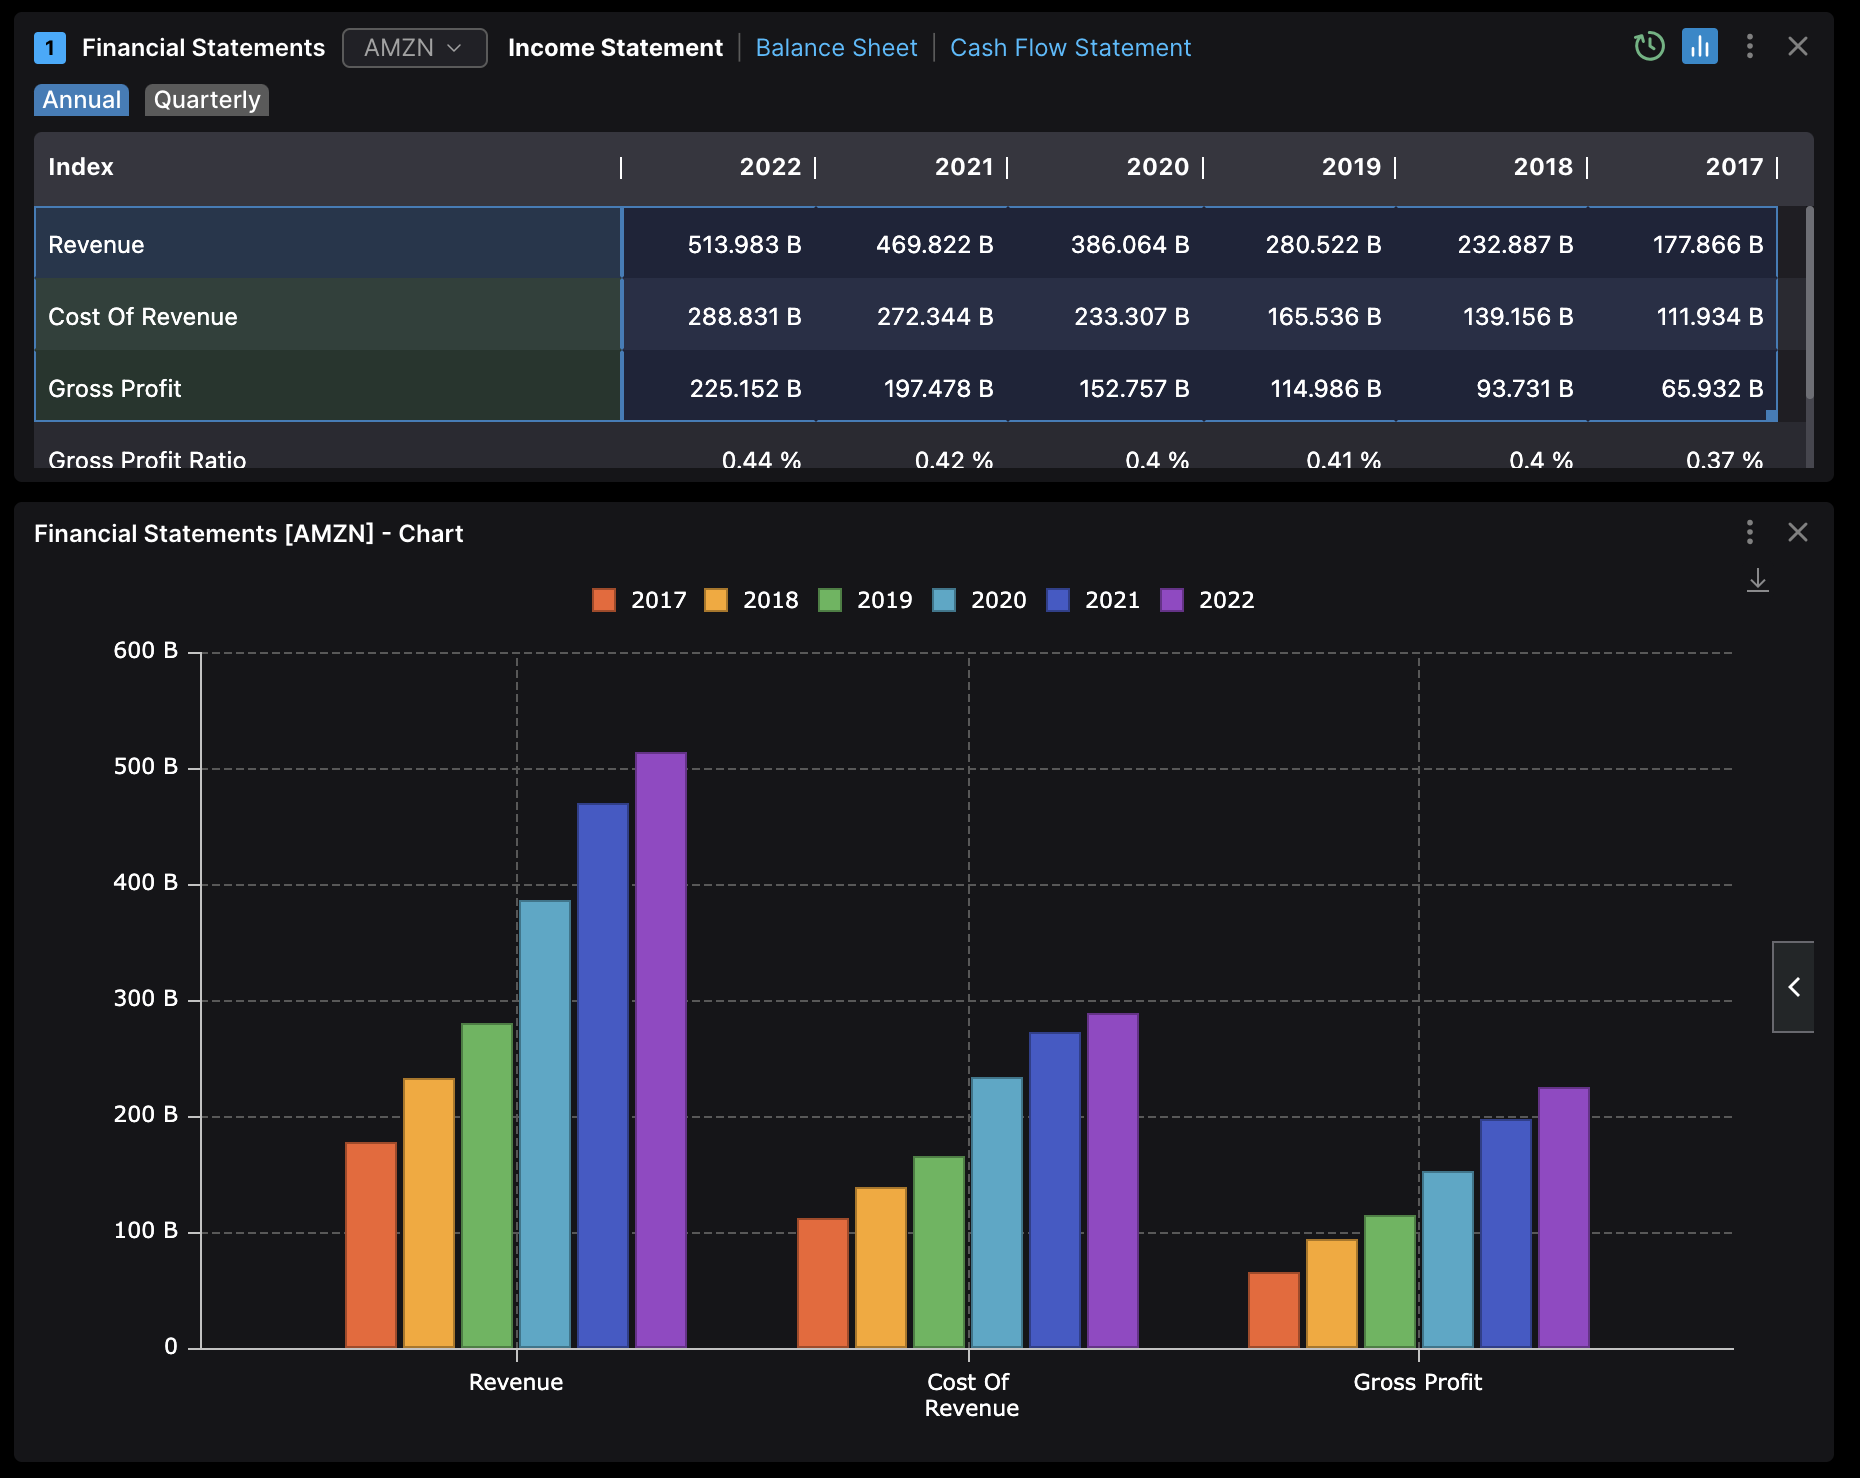
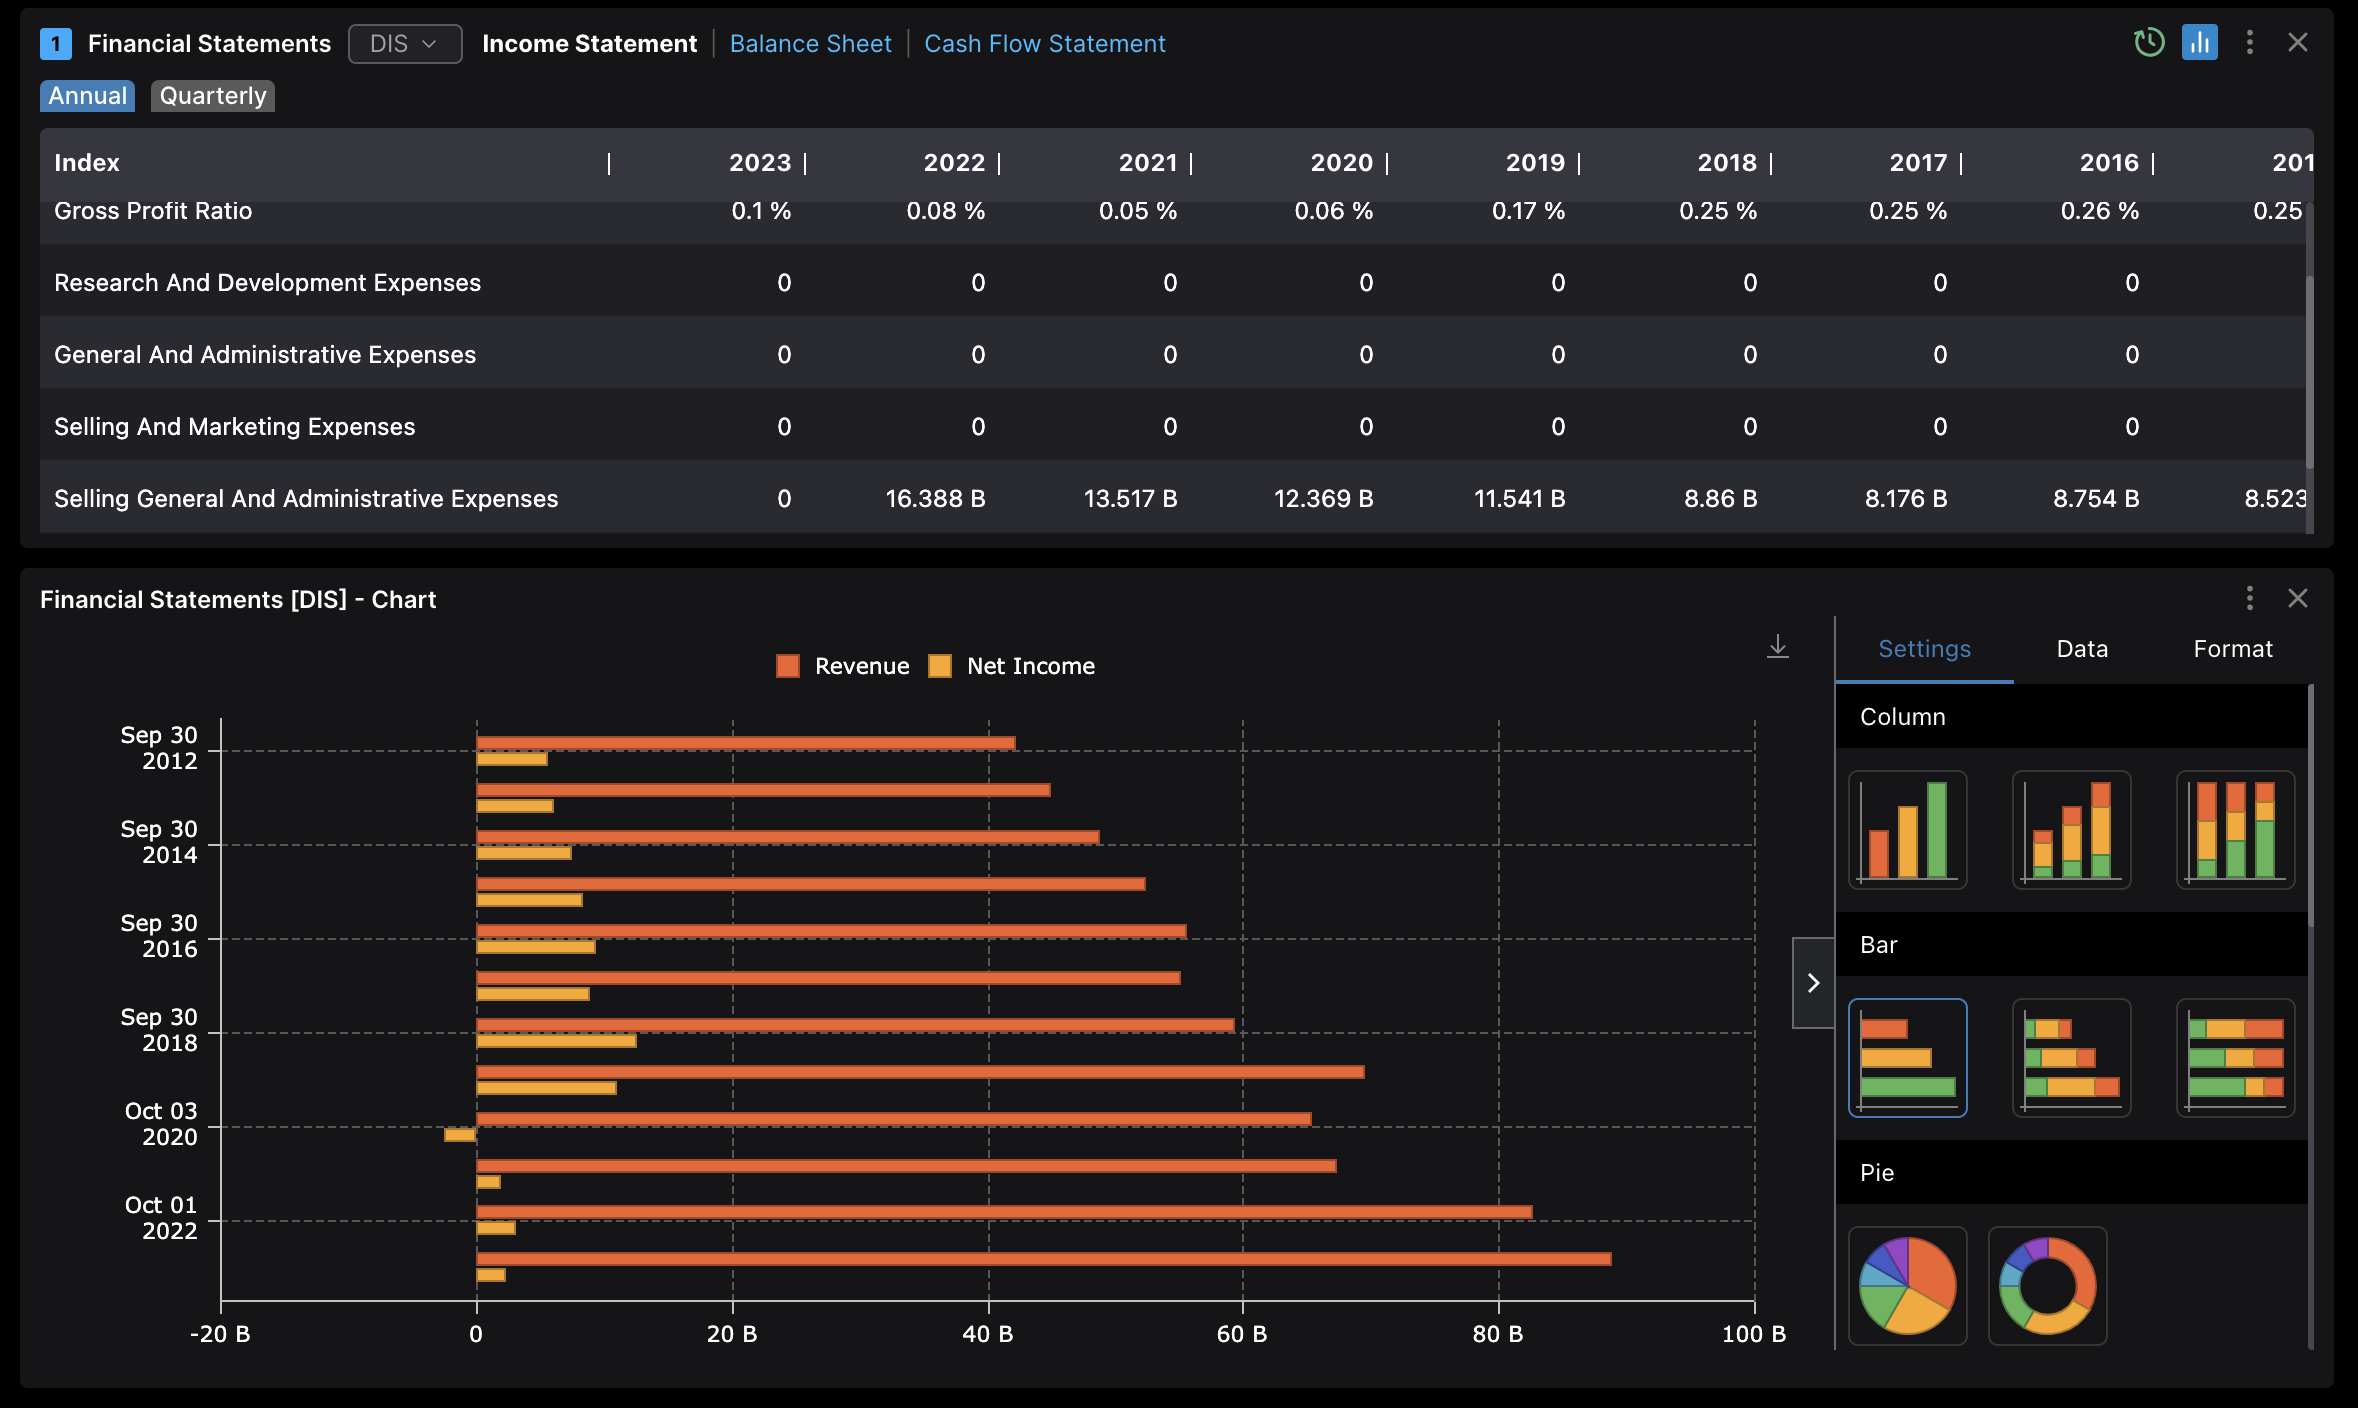
In the world of investment research, data is king. But raw, tabular data can be overwhelming and difficult to interpret. That's where charts come in. They transform complex data sets into visual narratives, making it easier to spot trends, compare variables, and make informed decisions.
With OpenBB Terminal Pro, you can create charts directly from your tabular data. Simply select the data you want to visualize, choose your preferred charting style, and let the software do the rest. It's a powerful tool for quants and analysts alike.
Here are a few examples to get you started: