---
title: Quantitative Analysis
description: The page provides an overview of Quantitative Analysis in finance and
its application in different asset classes like Crypto, Forex, and Stocks. It also
highlights its usage in making profitable investment decisions, the use of terminal
commands for analyzing data, and the export of data for further analysis.
keywords:
- Quantitative analysis
- Asset classes
- Finance
- Crypto
- Forex
- Stocks
- Terminal
- Financial quantitative analysis
- Investment decisions
- Statistics
- Metrics
- Risk
- Investors
- Quantifiable statistics
- Command summary
- Line chart
- Target column
- Observation window
---
import HeadTitle from '@site/src/components/General/HeadTitle.tsx';
Quantitative analysis (QA) in finance is an approach that emphasizes mathematical and statistical analysis to help determine the value of a financial asset, such as a stock or option. The ultimate goal of financial quantitative analysis is to use quantifiable statistics and metrics to assist investors in making profitable investment decisions. Quantitative analysis is different from qualitative analysis, which looks at factors such as how companies are structured, the makeup of their management teams, and what their strengths and weaknesses are.
The Quantitative Analysis menu is a common menu to three asset classes:
- Crypto
- Forex
- Stocks
## Usage
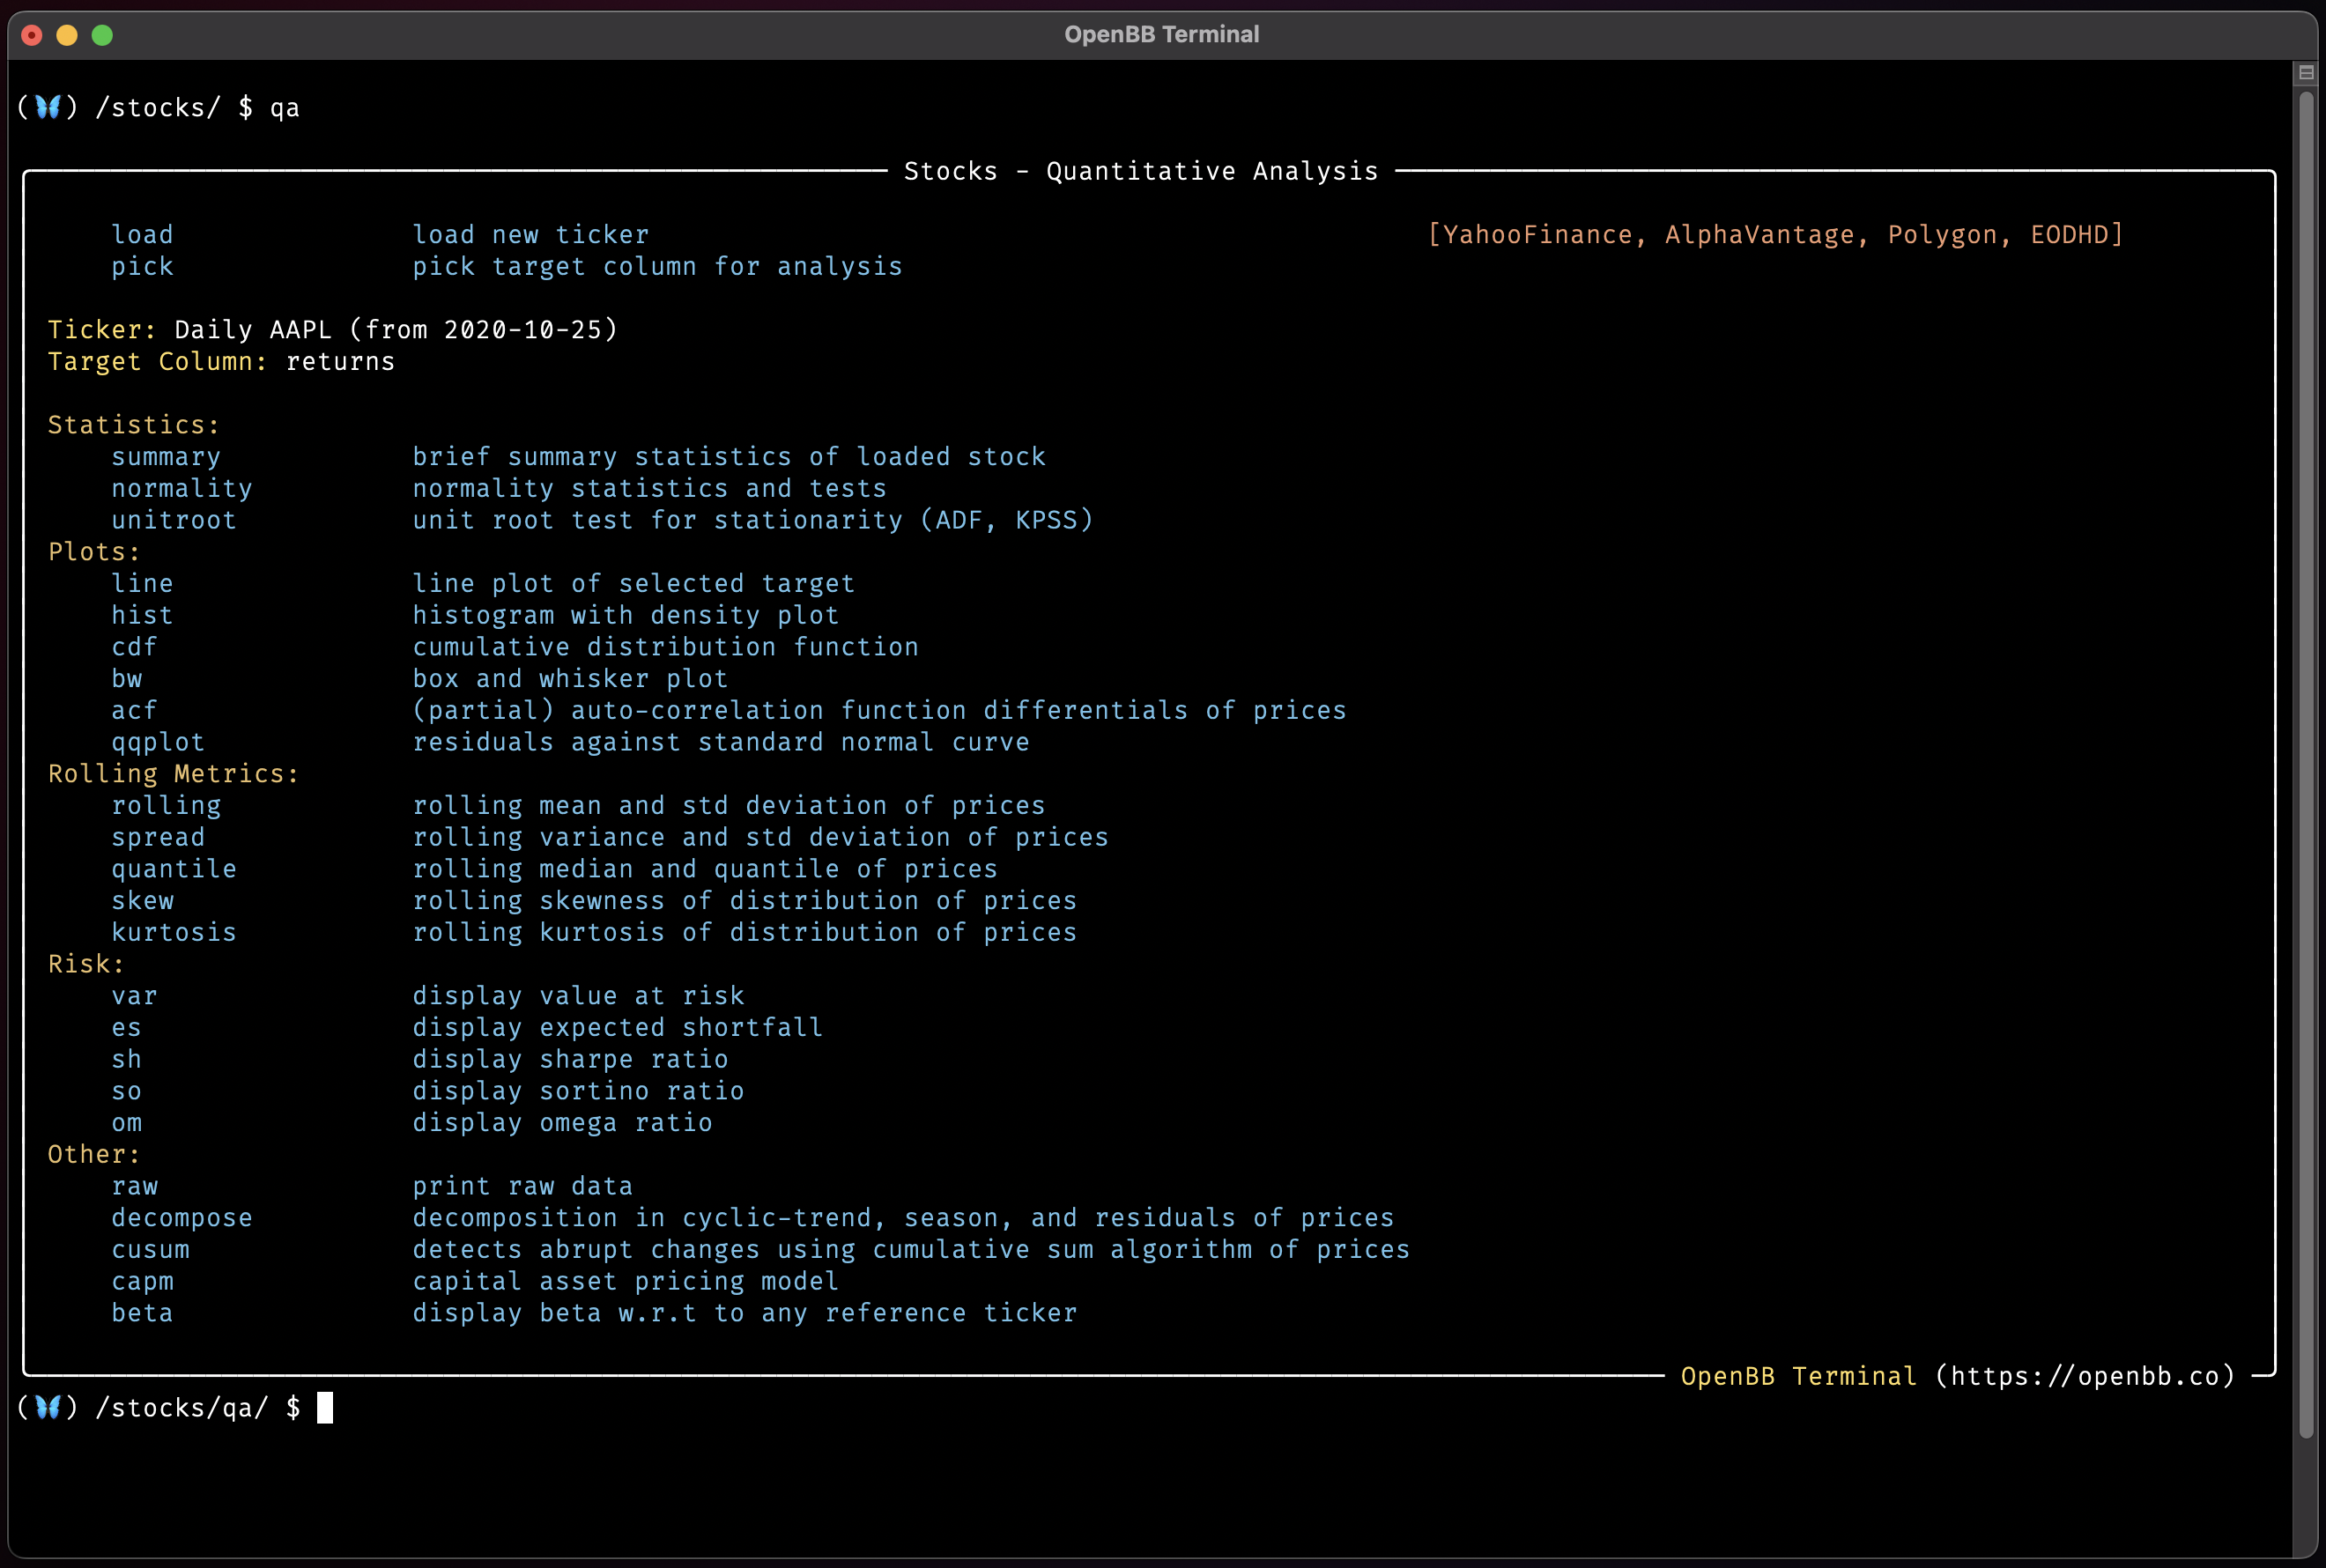
Enter the menu, through one of the asset classes listed above, by entering `qa` in the Terminal. The ticker that is loaded before entering the menu will determine the timeframe for the analysis. To alter it, use the `load` function and pick a new `--start` and `--end` for the observation window. The QA functions target a specified column of the data. By default, this is returns. Use the `pick` command to chose a new target column.
The menu is divided into five categories of functions:
- Statistics
- Rolling Metrics
- Risk
- Other
### Summary
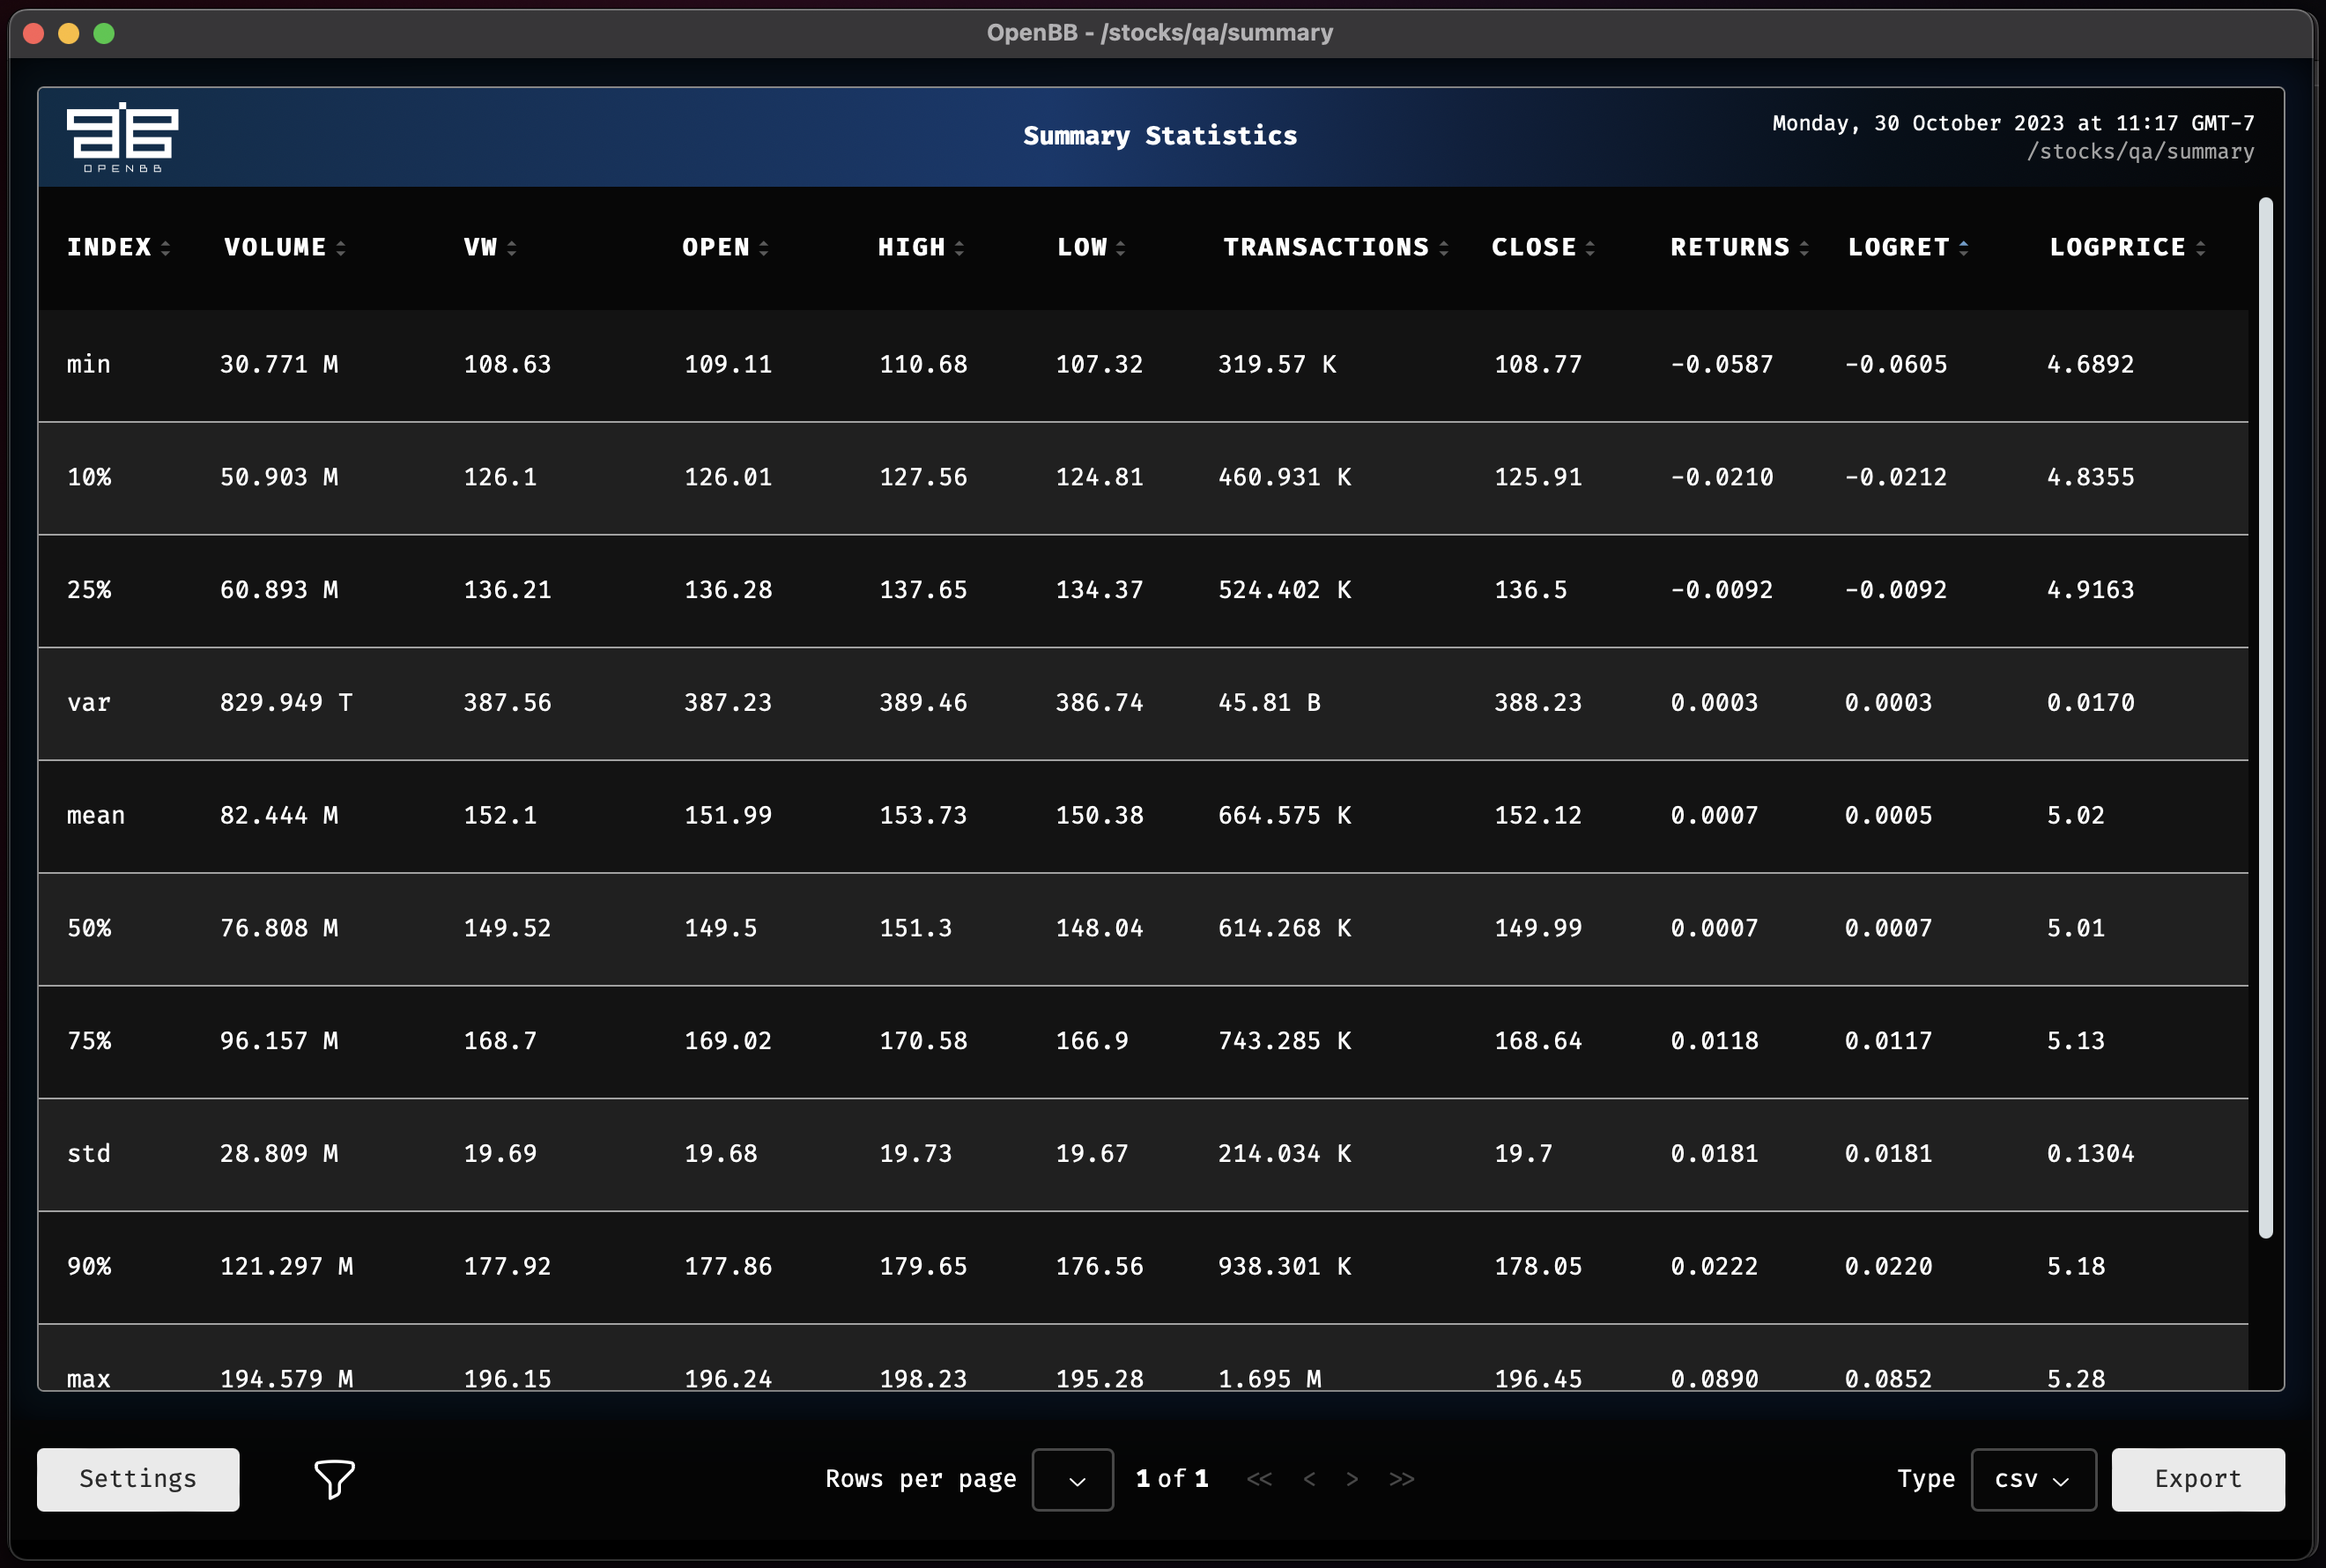
A summary of exportable statistics is displayed with the command, `summary`. The example here shows AAPL.
```console
stocks
load aapl
qa
summary
```
### Line
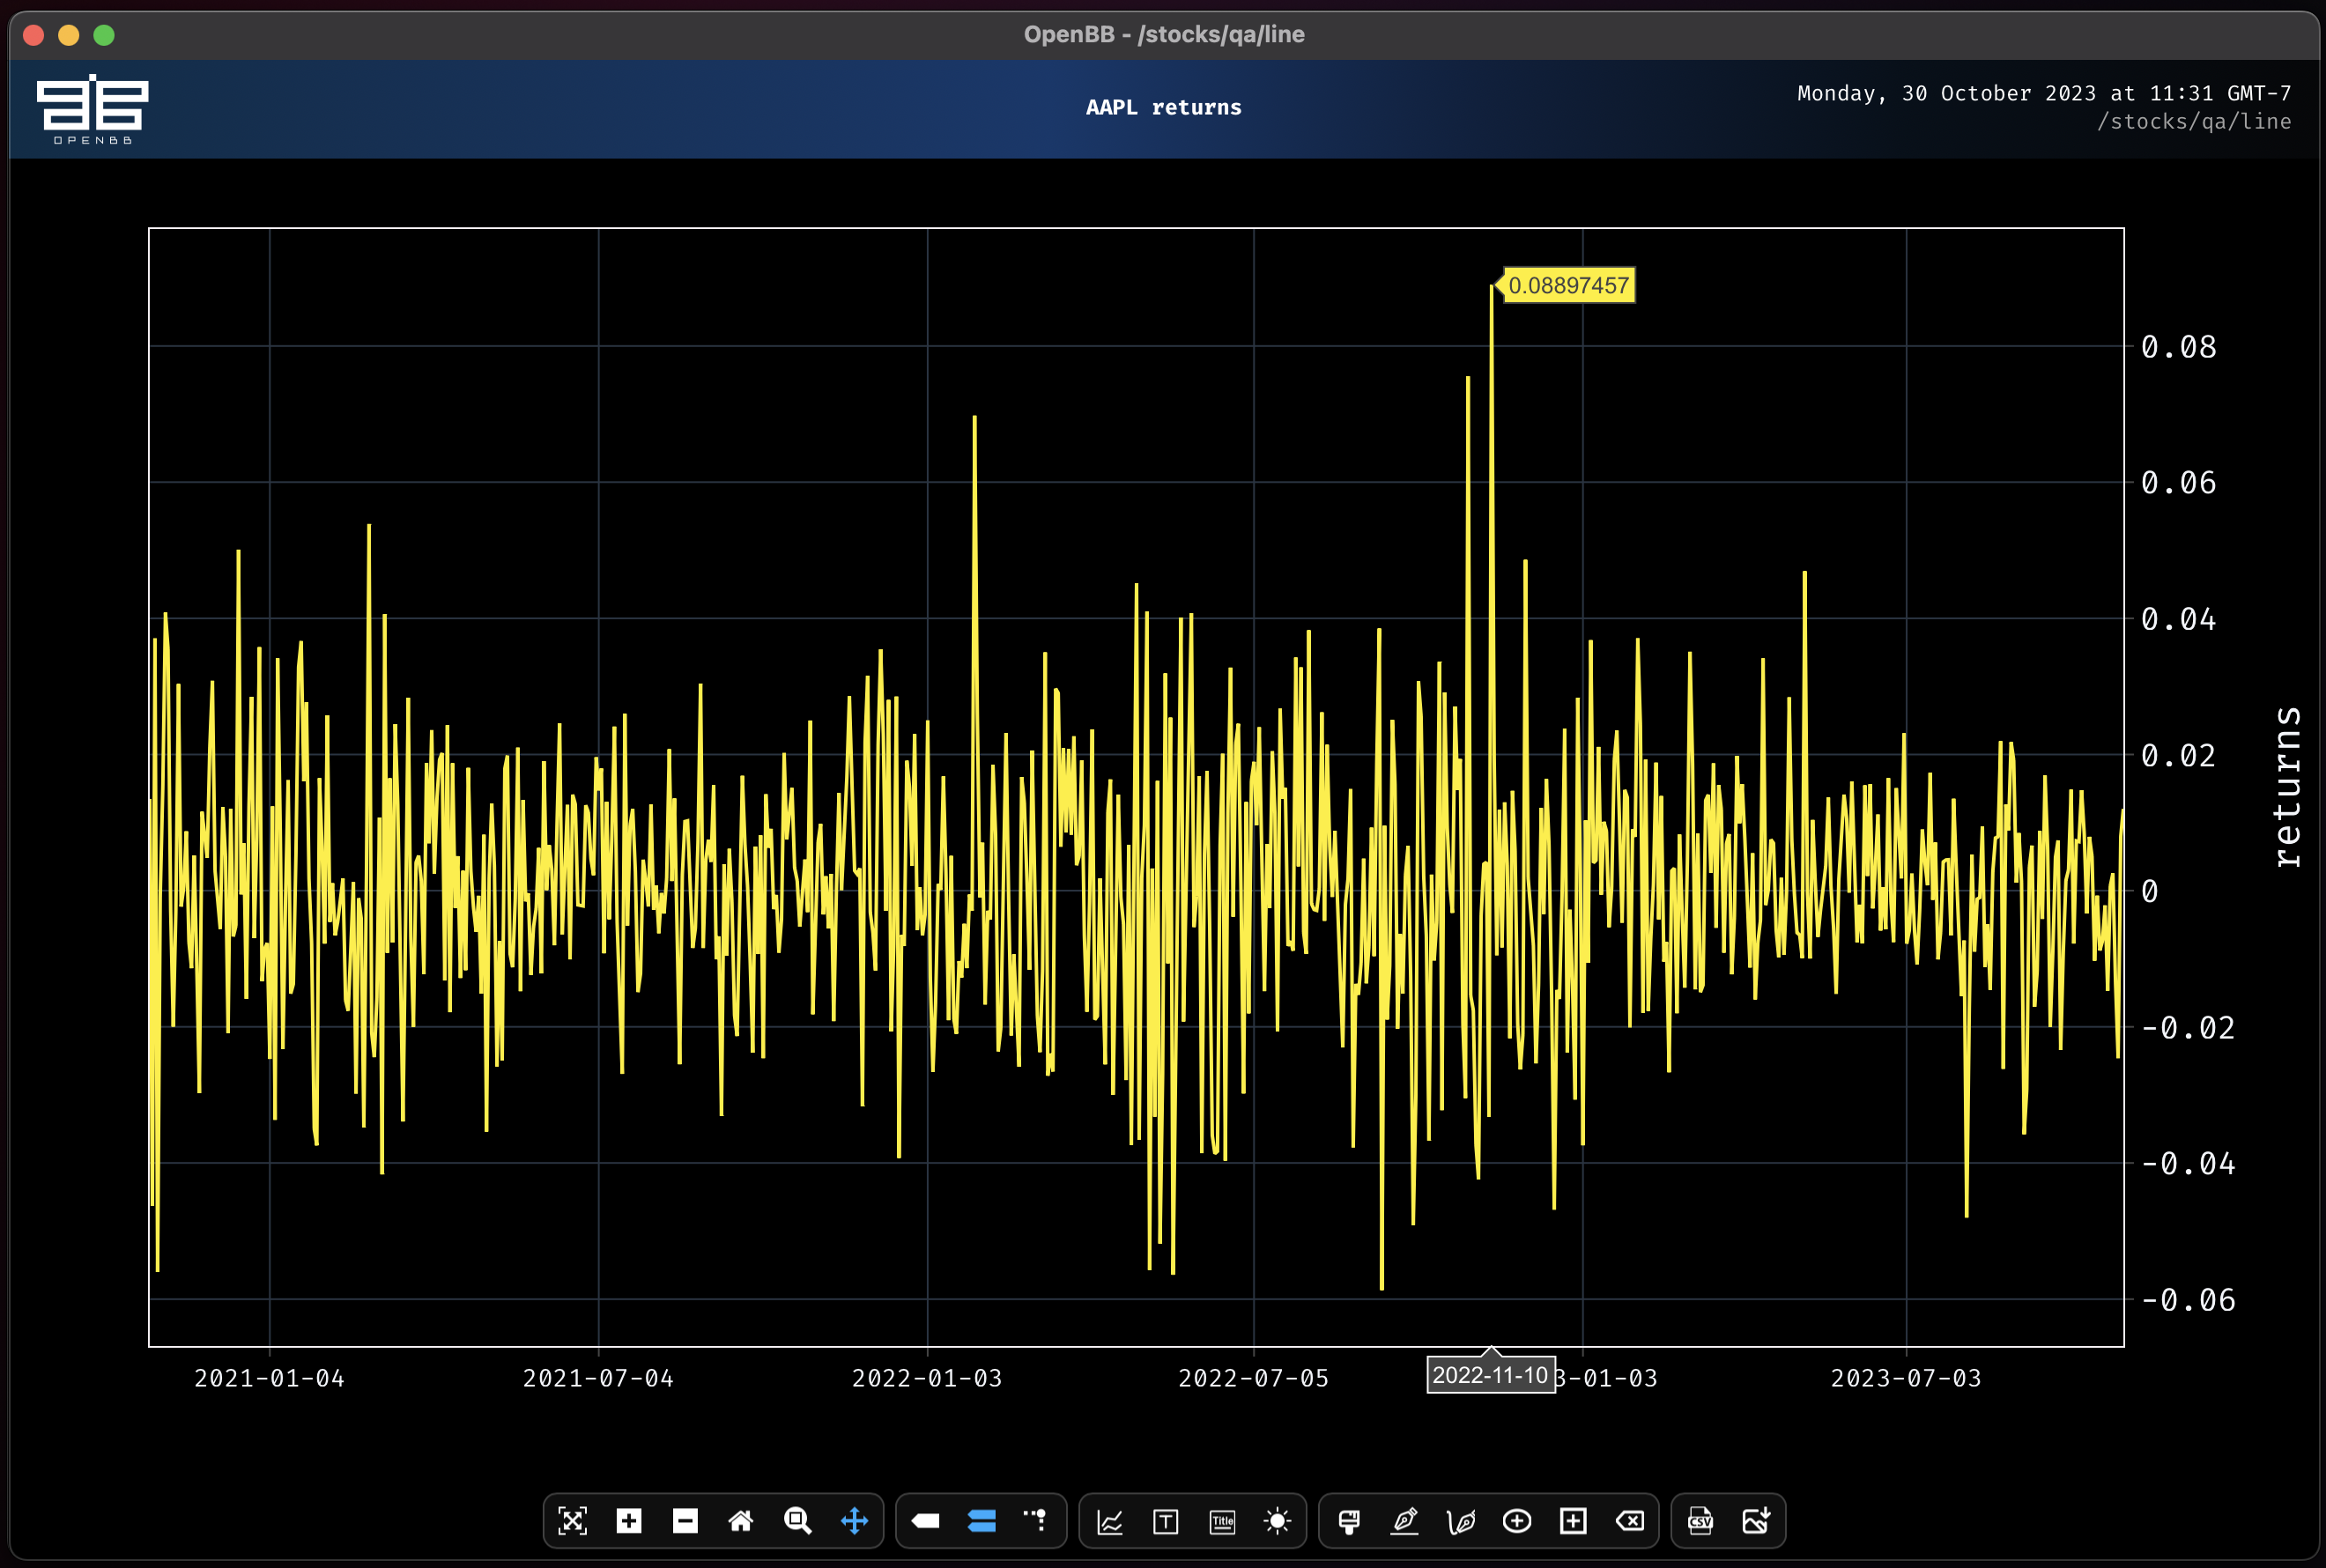
A simple line chart for the target column as a time-series is called with the `line` command, for example the `returns` column.
To use the same data and target column, enter:
```console
line
```
### Beta
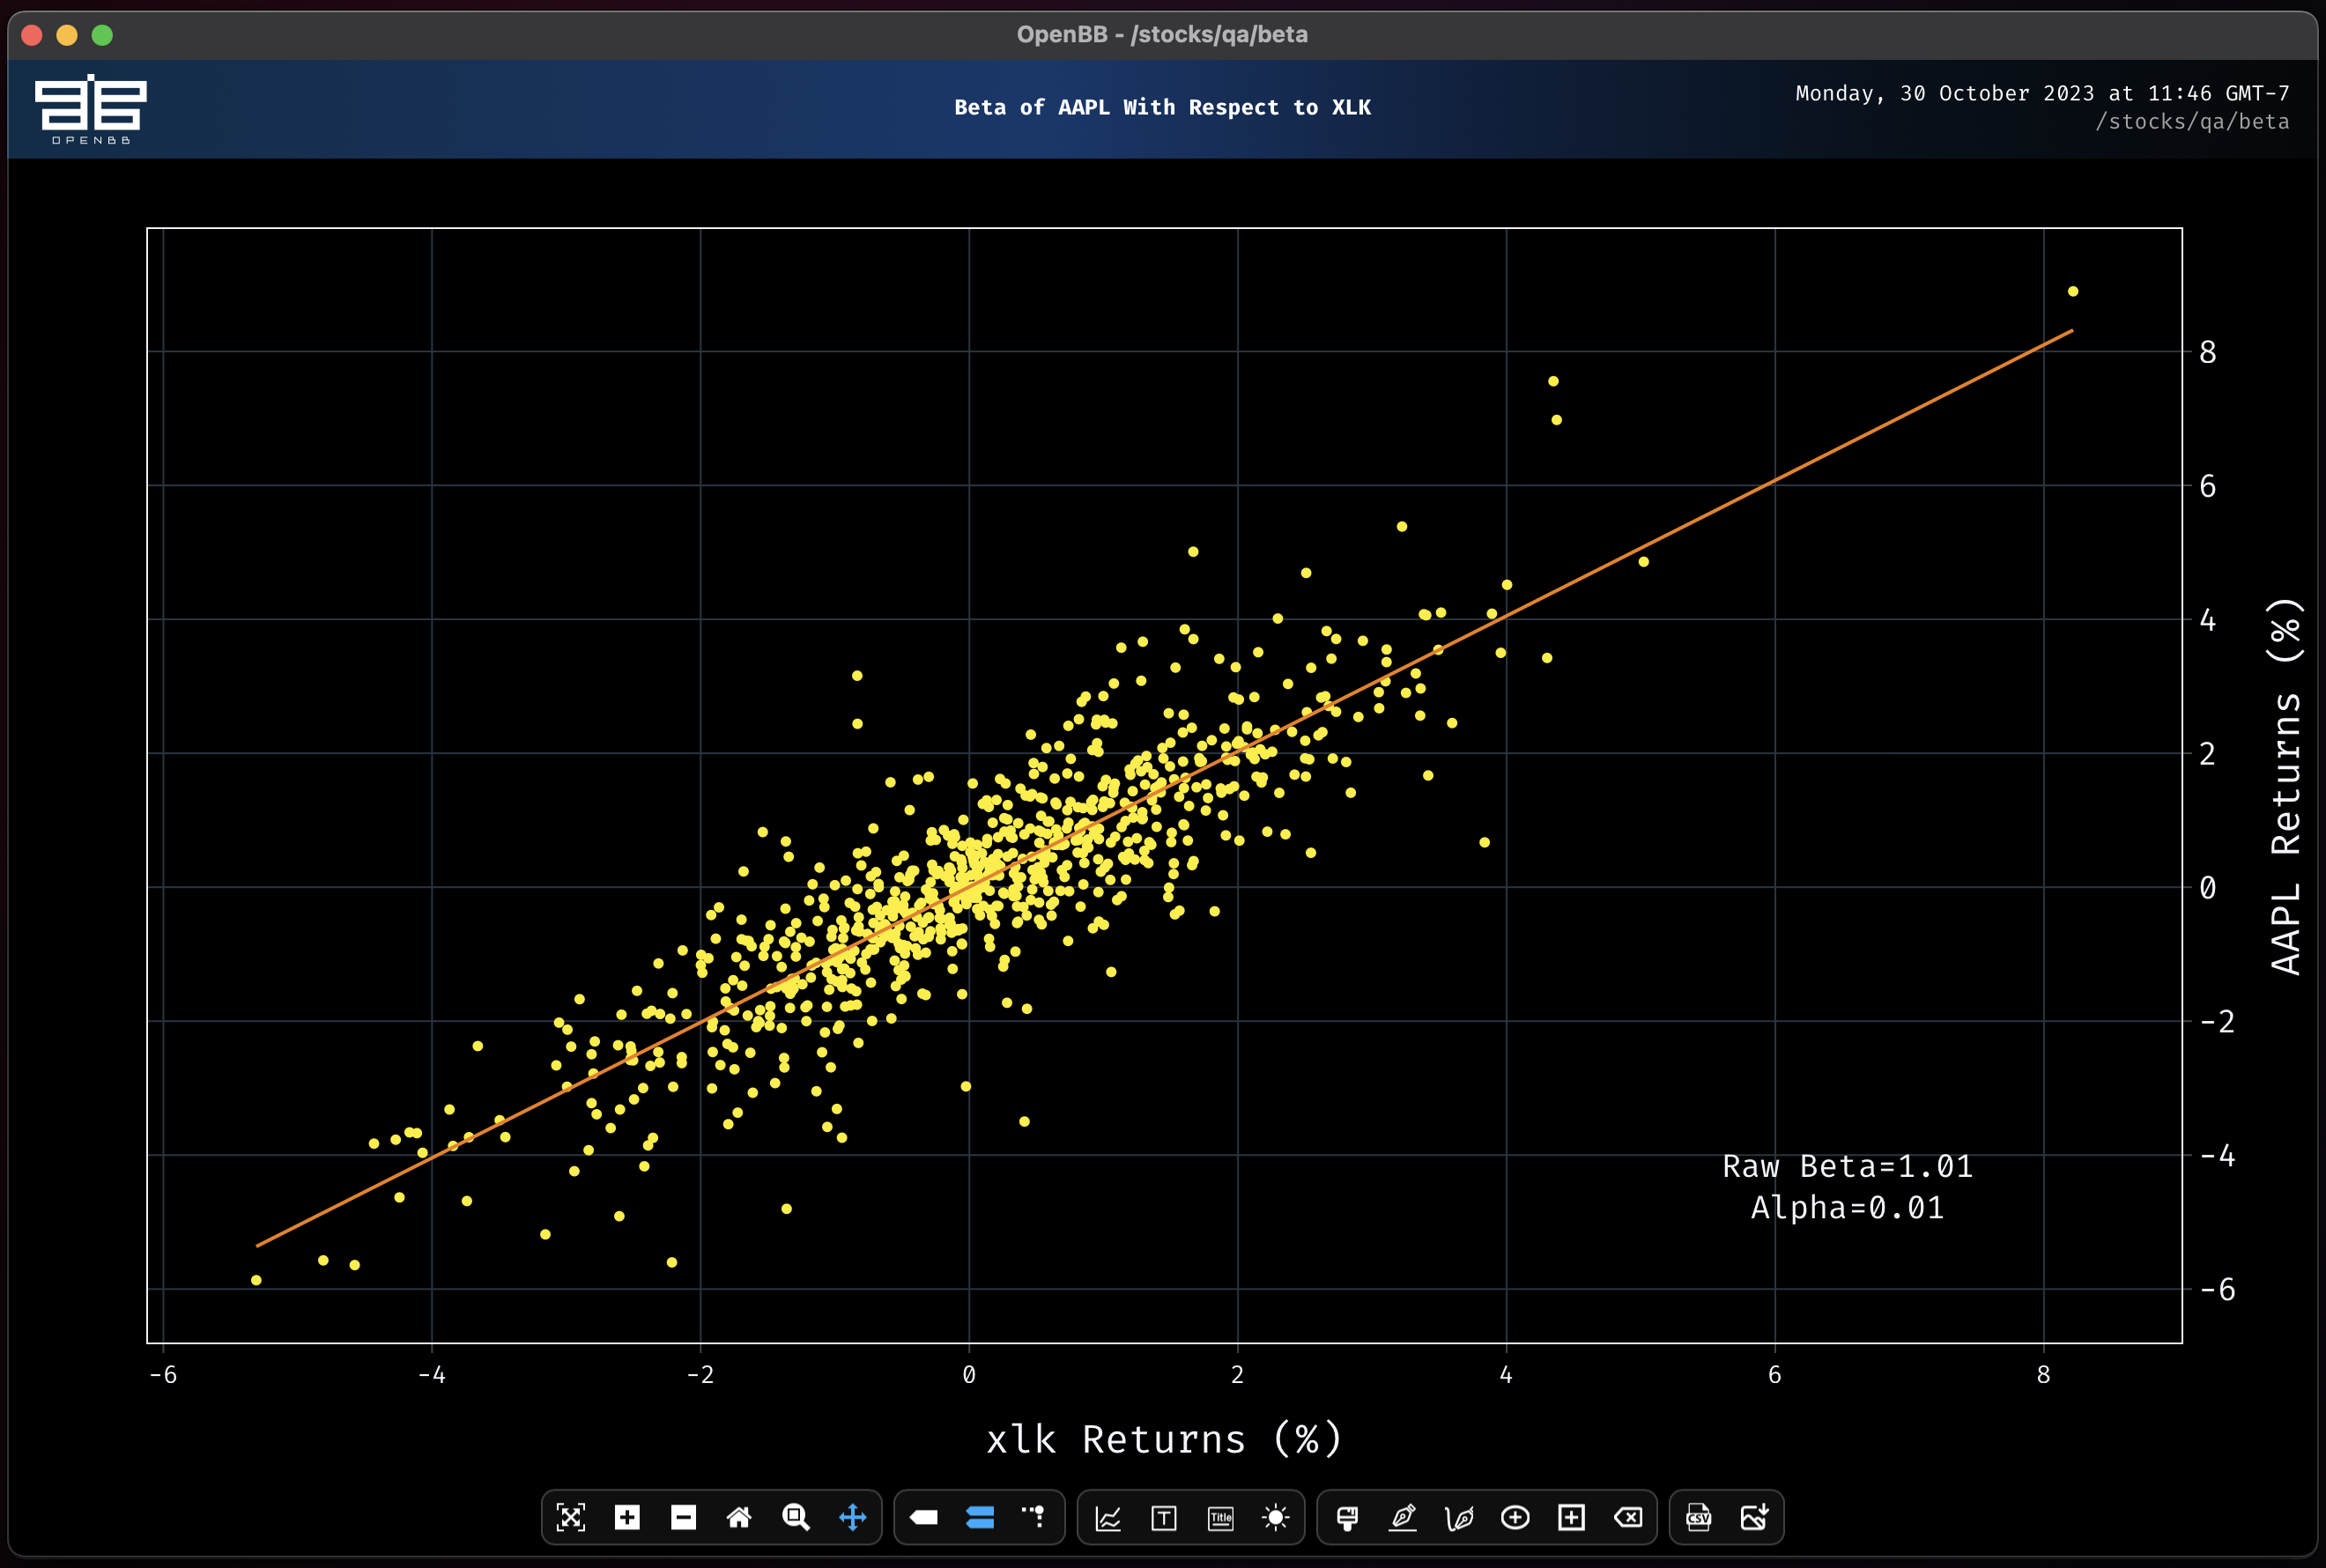
The `beta` command shows the beta of the loaded asset with respect to another. Use the `-r` parameter to select the asset to compare against.
```console
beta -r xlk
```
### Pick
To select a different target, like log returns, use the `pick` command.
```console
pick -t logret
```
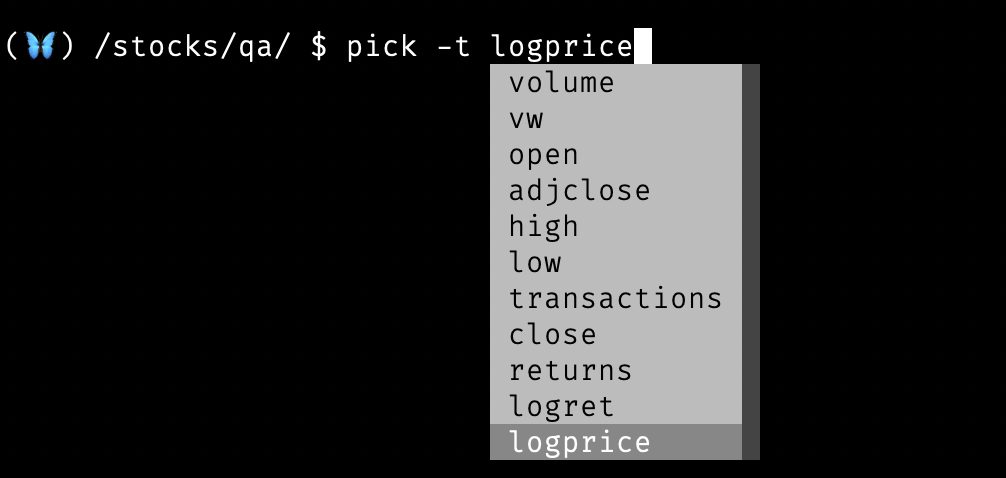
The choice will be reflected on-screen after the menu is refreshed, `?`, `h`, `help` - with no command attached.
### Rolling
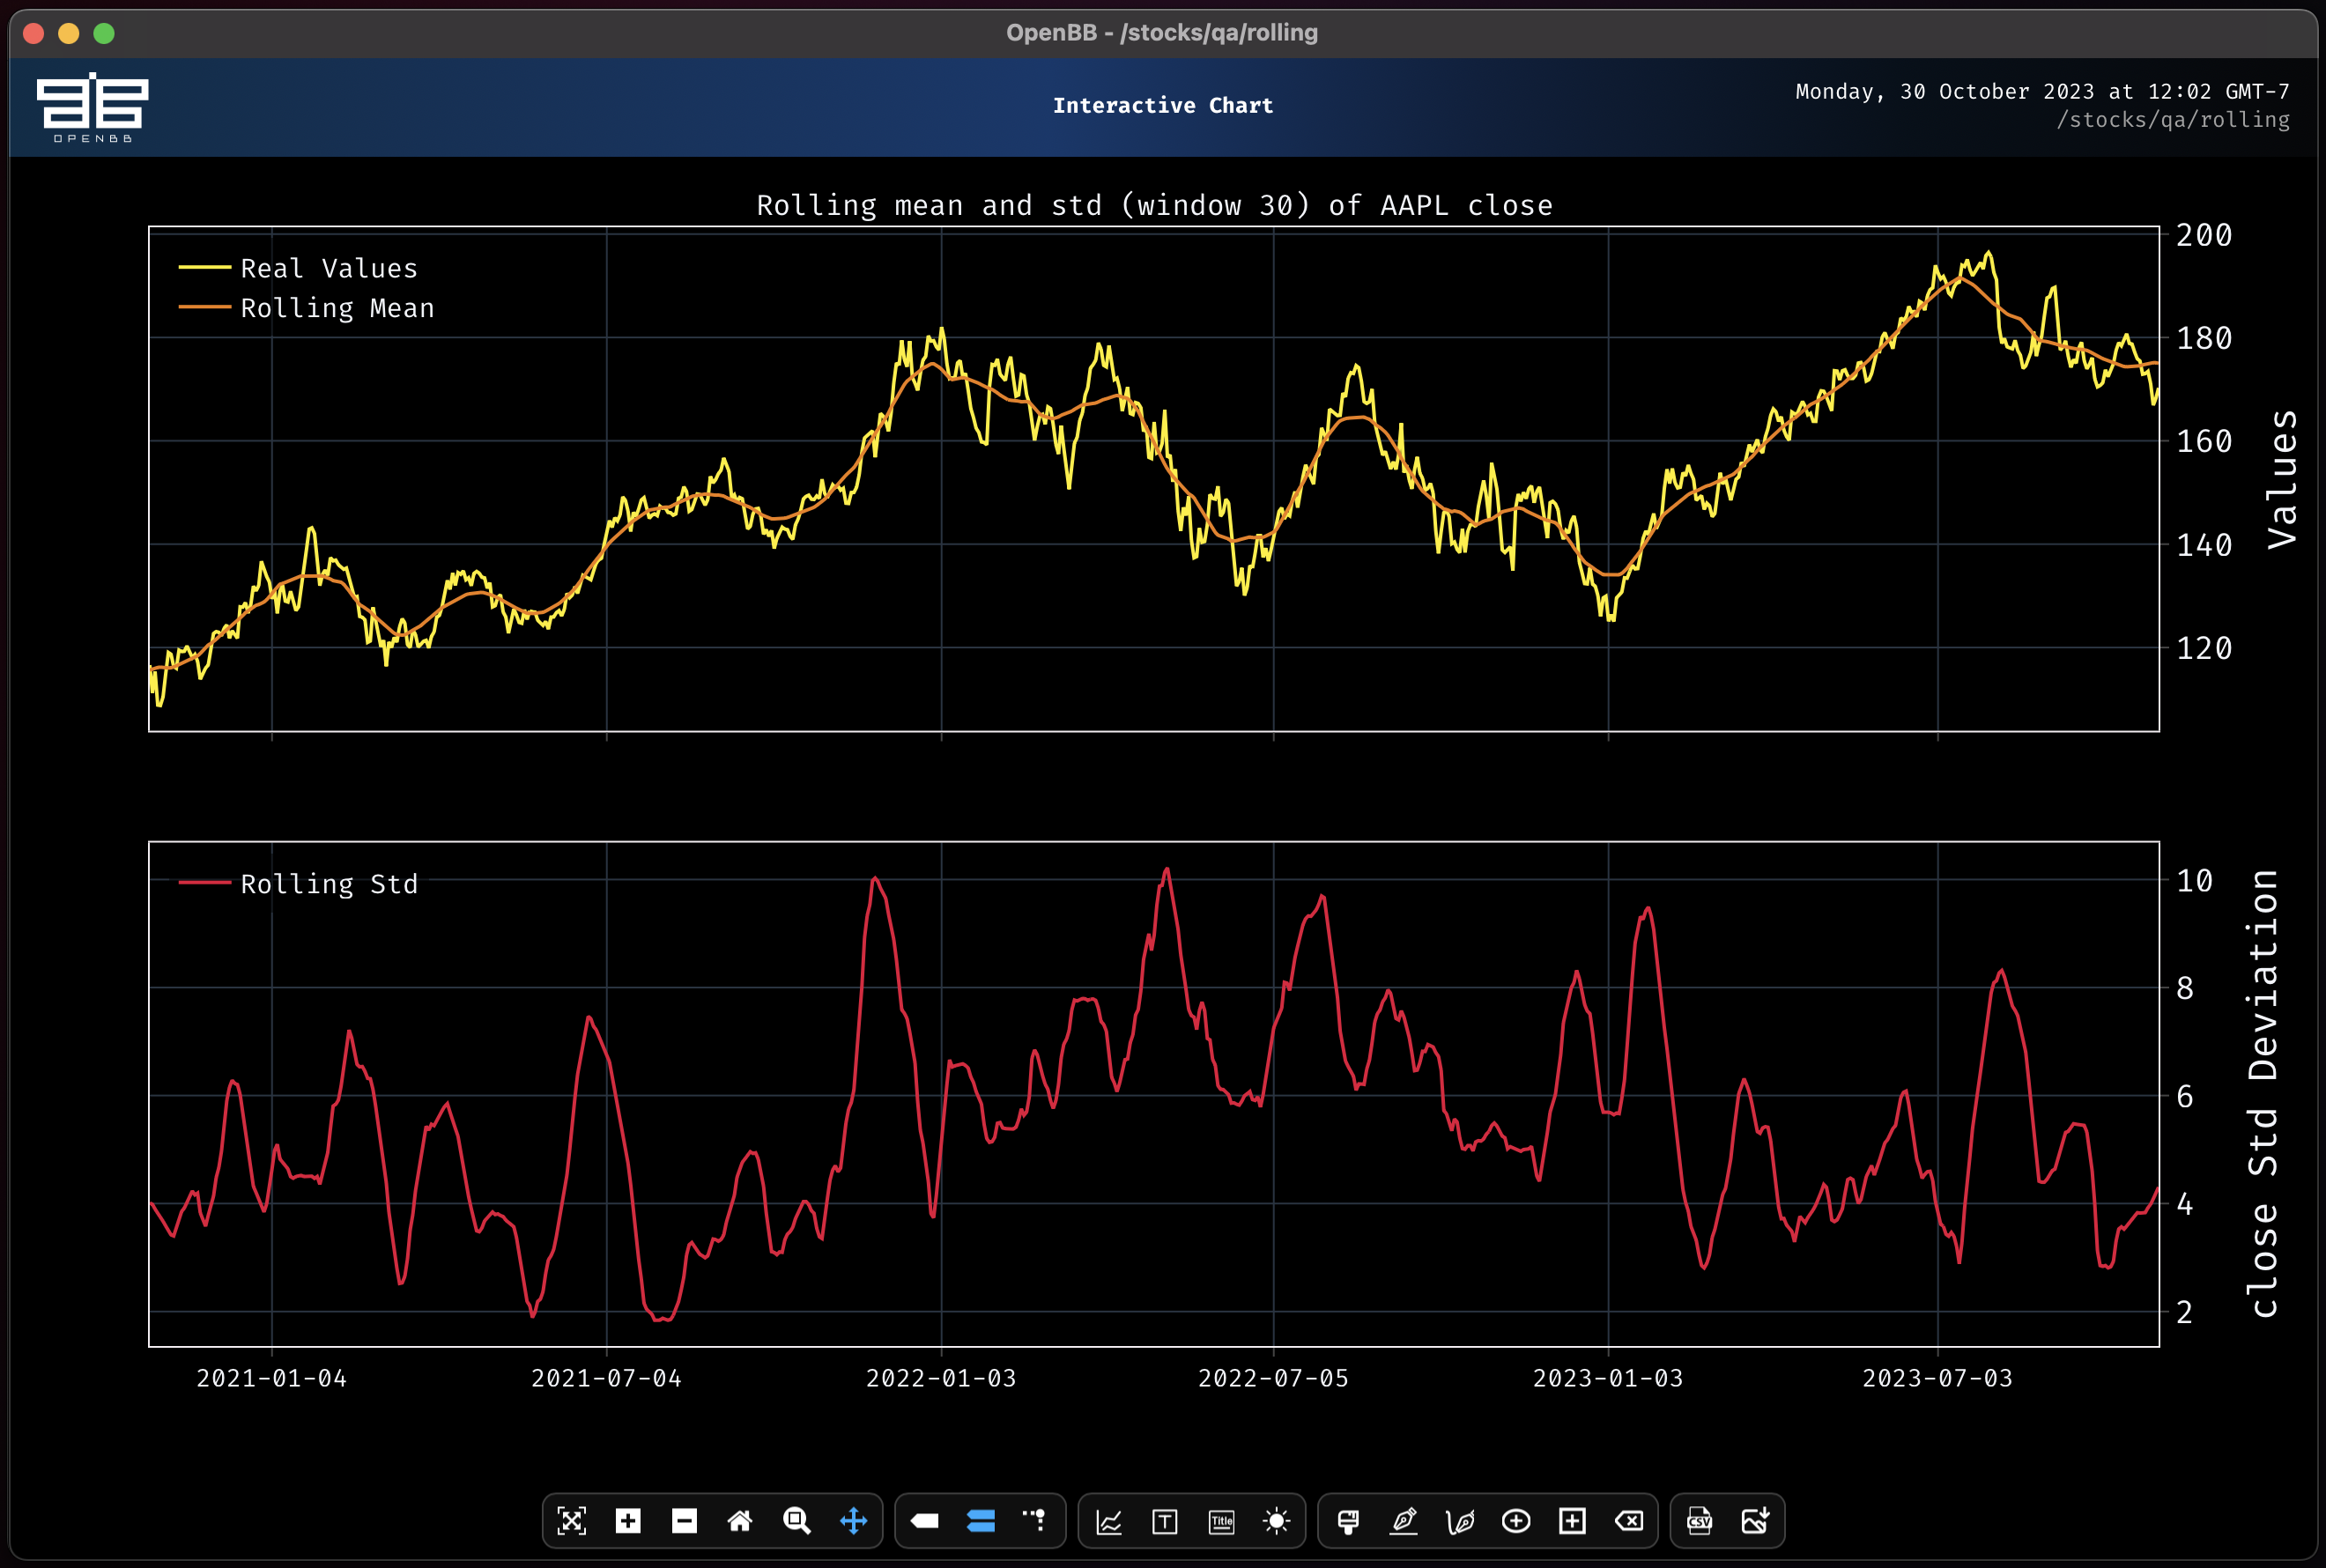
The `rolling` command plots the rolling mean and standard deviation of the target column over a selectable window of time.
```console
pick -t close
rolling --windows 30
```
### CDF
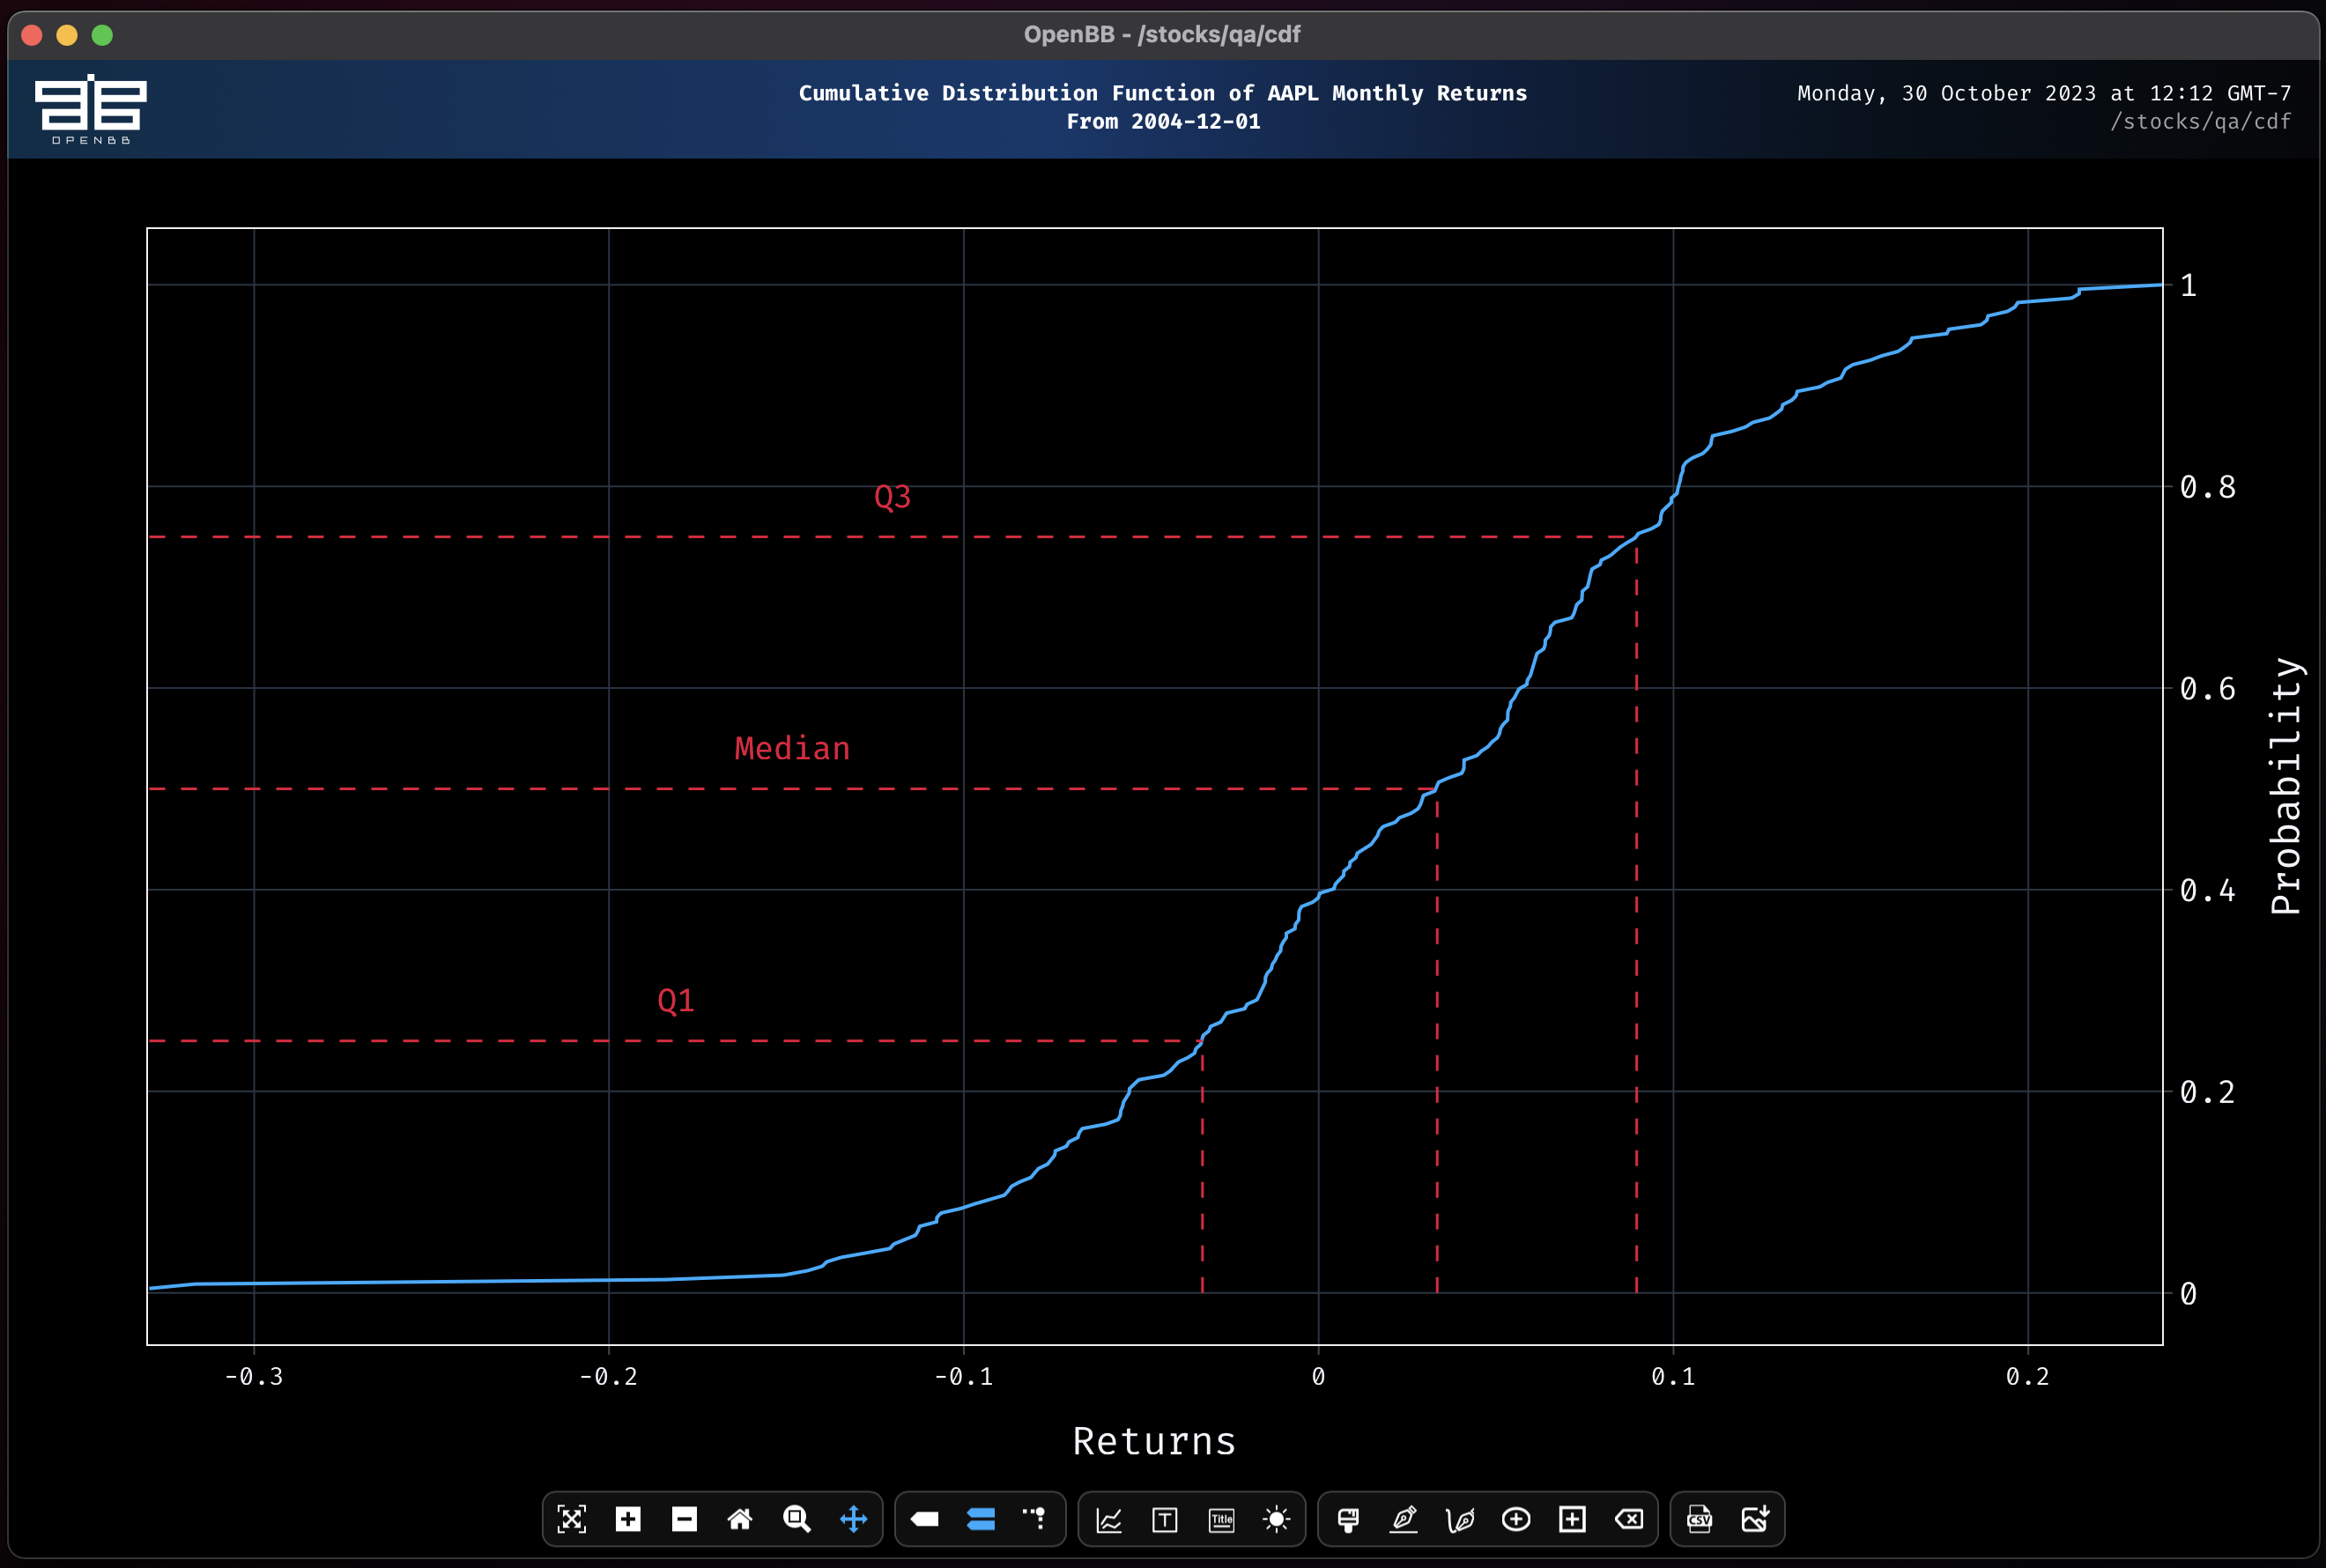
The Cumulative Distribution Function (`cdf`) displays the probabilities with quantiles.
```console
load aapl --start 2004-10-30 --monthly
pick -t returns
cdf
```
### Skew
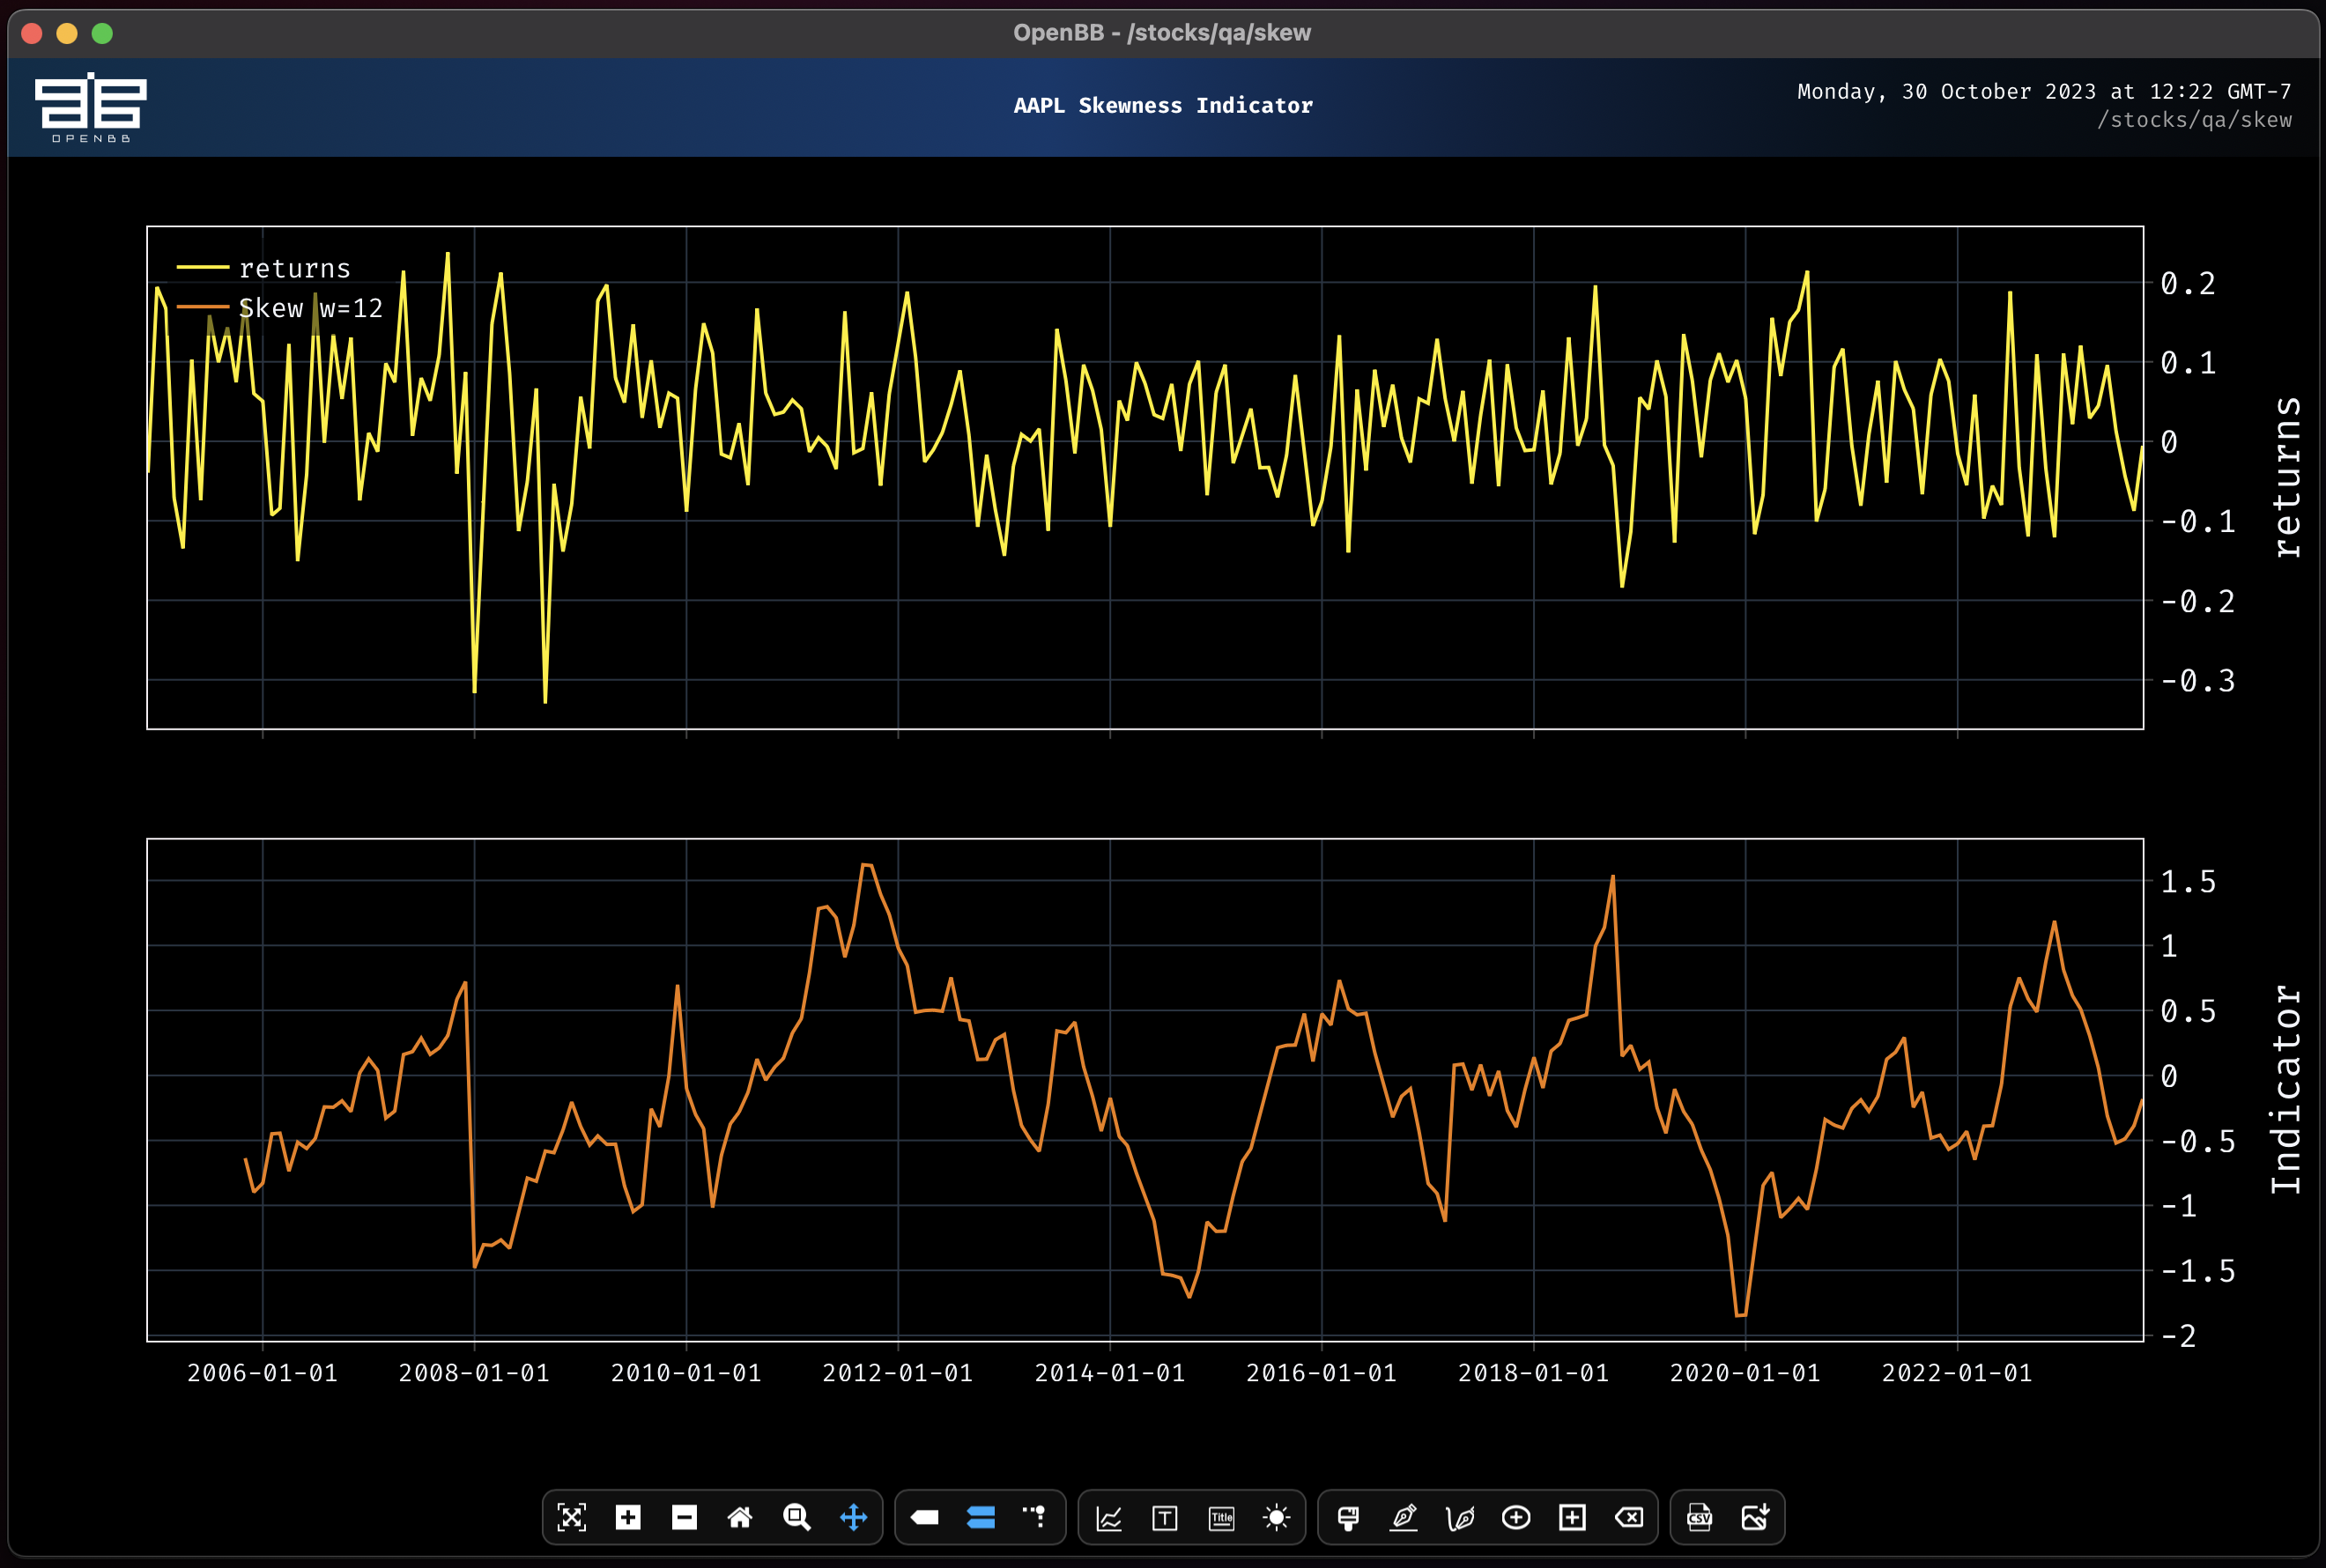
The `skew` command shows the asymmetric distribution over a specified window. Adjust this window to suit the interval of data loaded. With monthly data, a window of 12 represents one-year.
```console
skew
```
### CAPM
The `capm` command uses the Fama French Factors to determine market risk against the loaded asset. The output of this function is printed directly to the screen.
```console
capm
```
```console
Beta: 1.24
Systematic Risk: 63.63%
Unsystematic Risk: 36.37%
```