# EXPLORATORY DATA ANALYSIS
This menu aims to perform exploratory data analysis on a pre-loaded stock, and the usage of the following commands along with an example will be exploited below.
* [summary](#summary)
* brief summary statistics
* [hist](#hist)
* histogram with density plot
* [cdf](#cdf)
* cumulative distribution function
* [bwy](#bwy)
* box and whisker yearly plot
* [bwm](#bwm)
* box and whisker monthly plot
* [rolling](#rolling)
* rolling mean and std deviation
* [decompose](#decompose)
* decomposition in cyclic-trend, season, and residuald
* [cusum](#cusum)
* detects abrupt changes using cumulative sum algorithm
* [acf](#acf)
* (partial) auto-correlation function differentials
## summary
```text
usage: summary
```
Summary statistics
 ## hist
```text
usage: hist
```
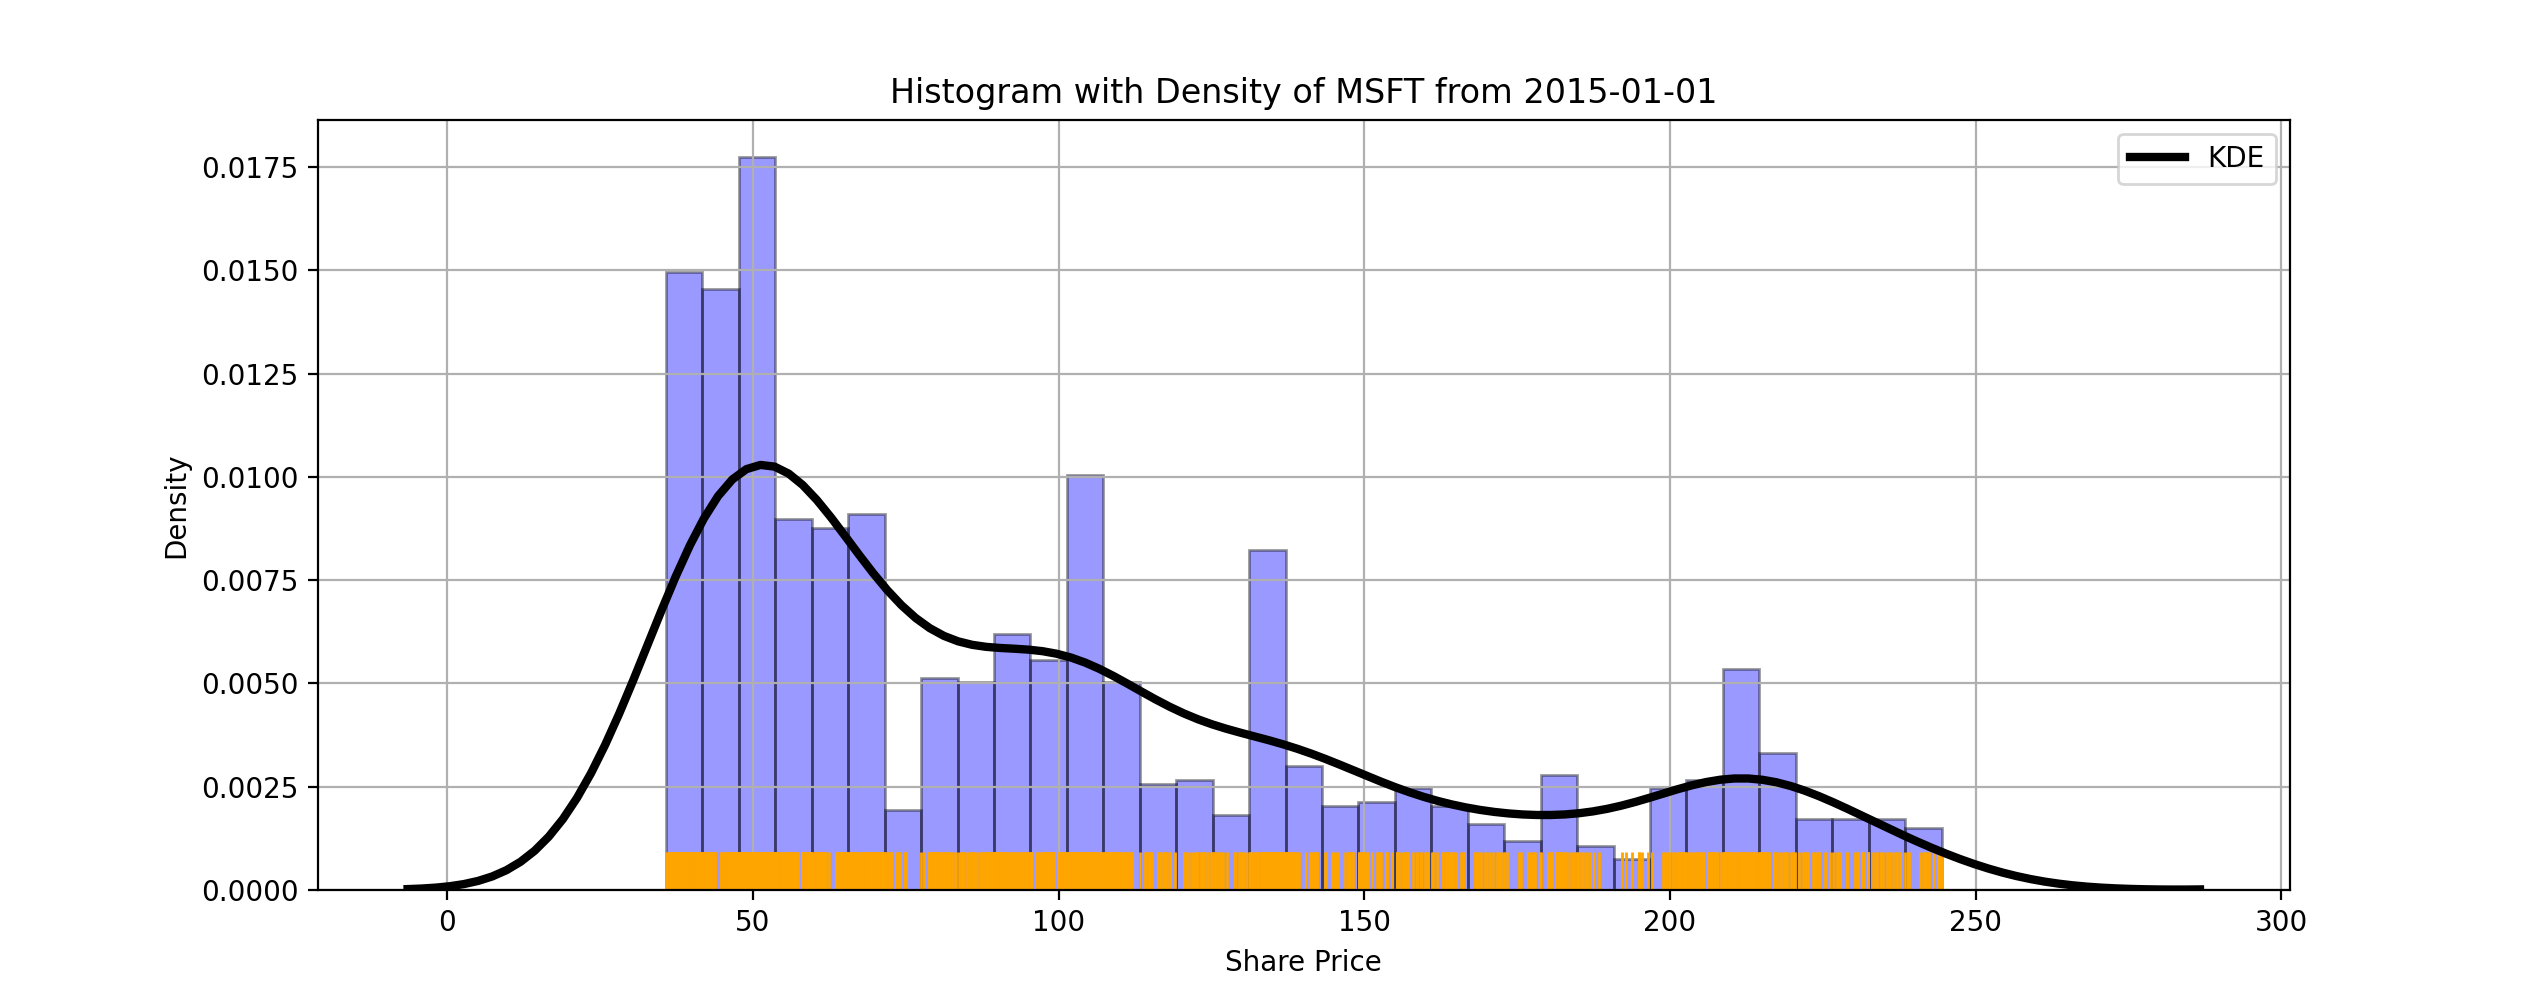
Plot histogram and density
## cdf
```text
usage: cdf
```
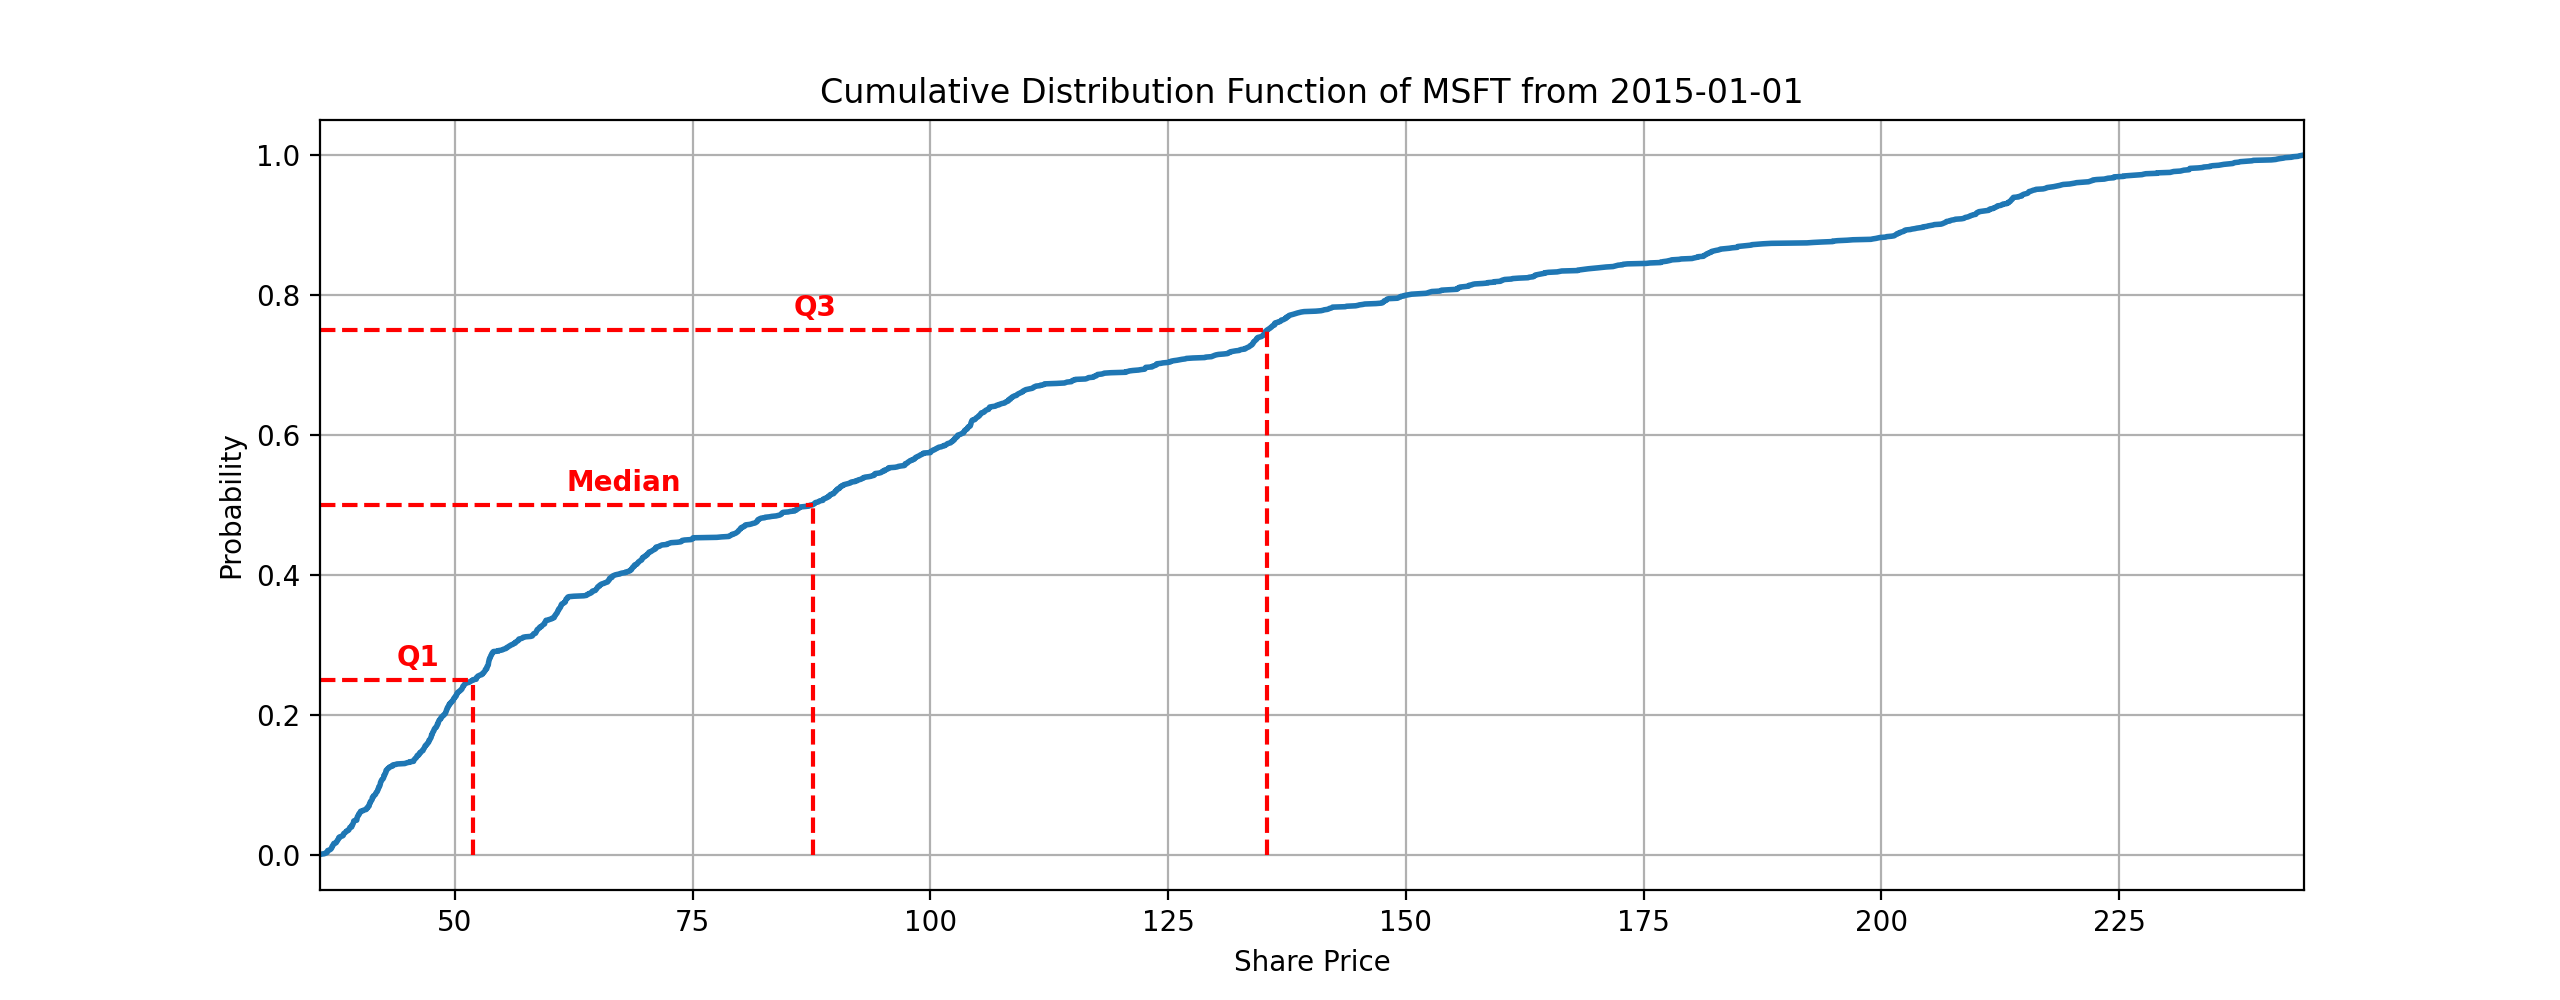
Plot cumulative distribution function
## bwy
```text
usage: bwy
```
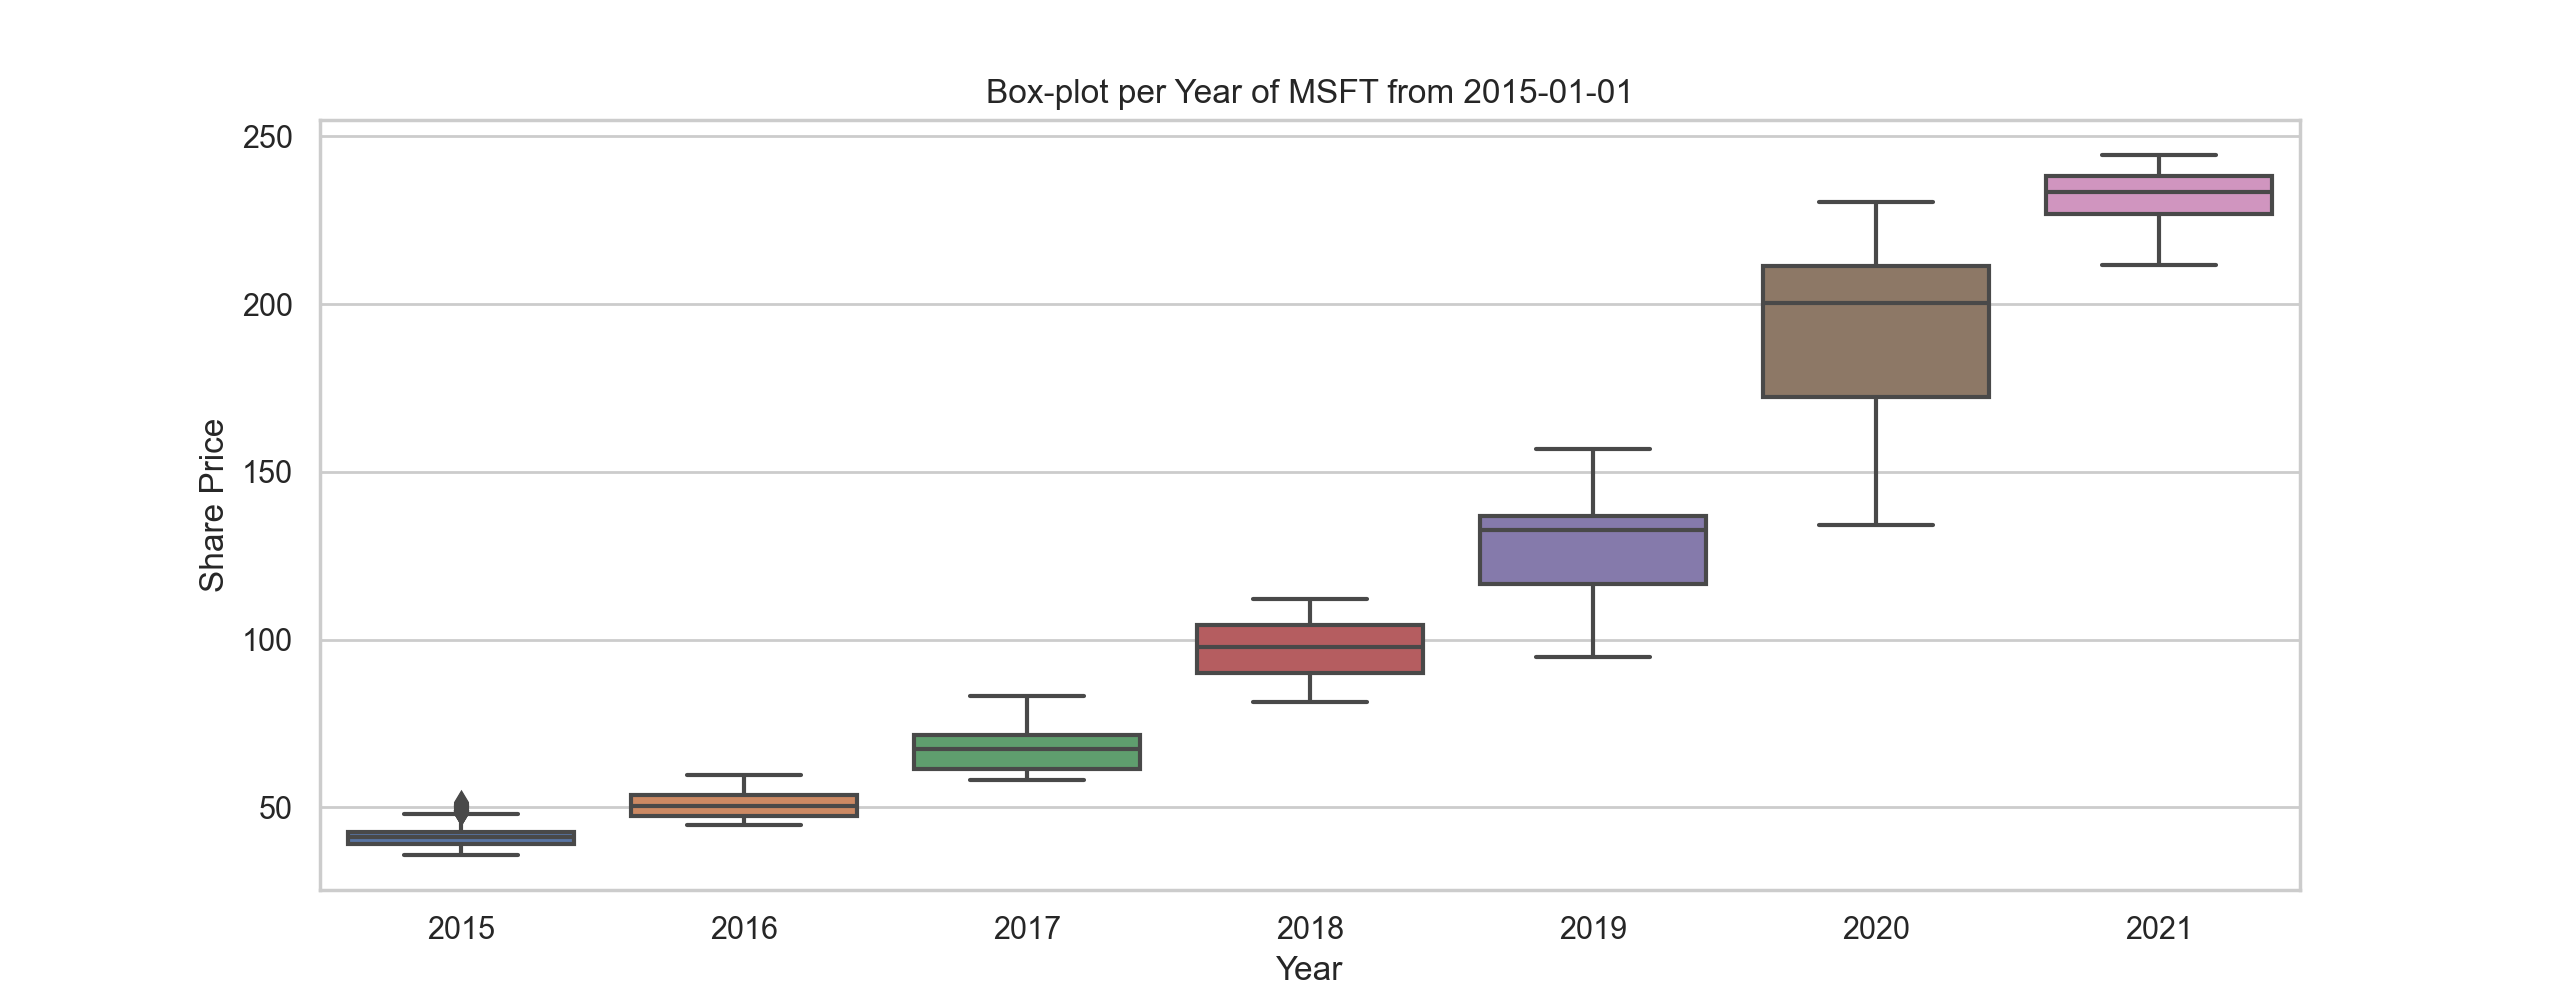
Box and Whisker plot yearly
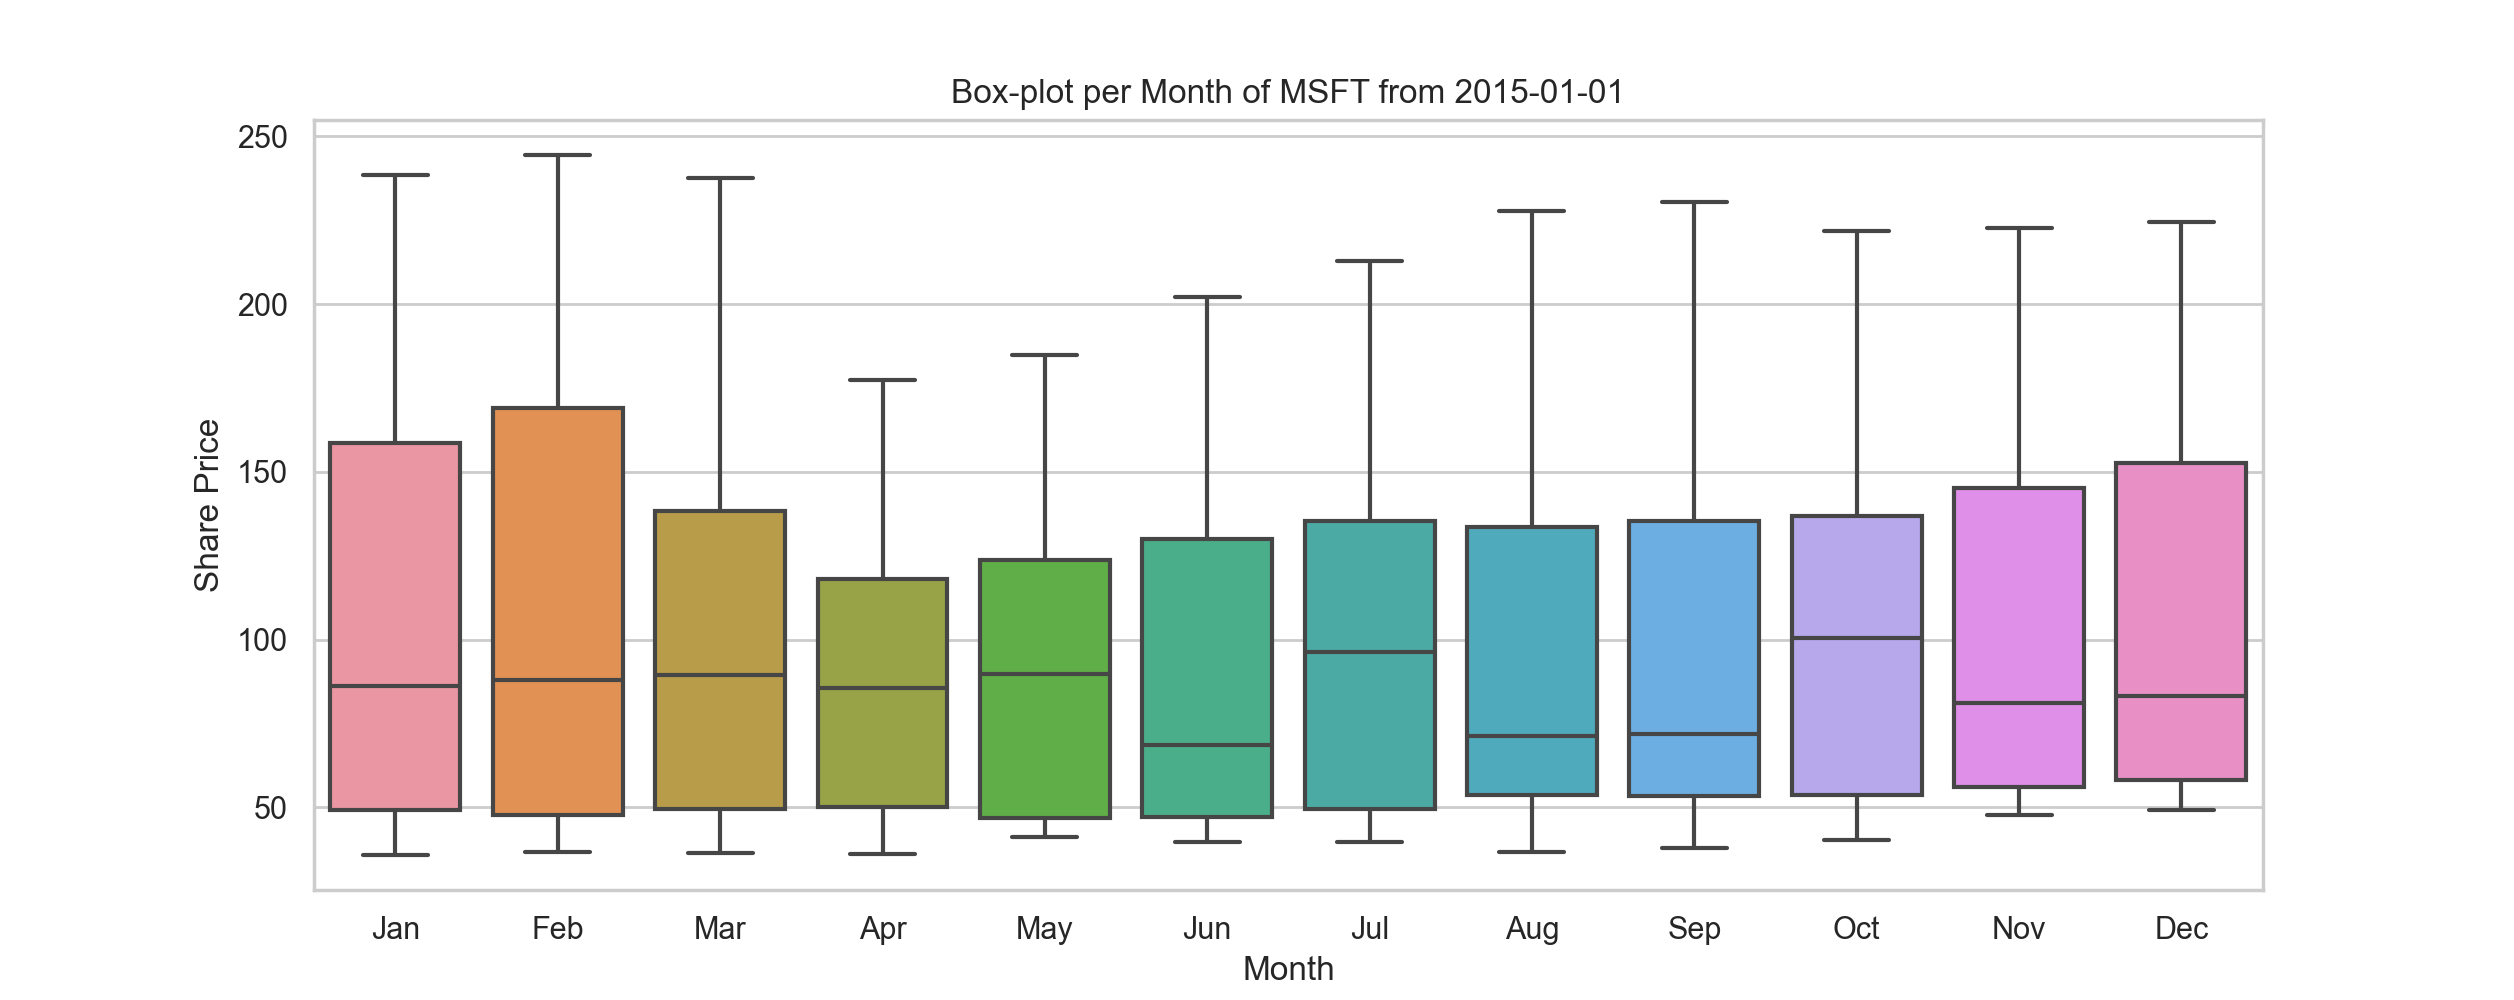
## bwm
```text
usage: bwm
```
Box and Whisker plot monthly
## rolling
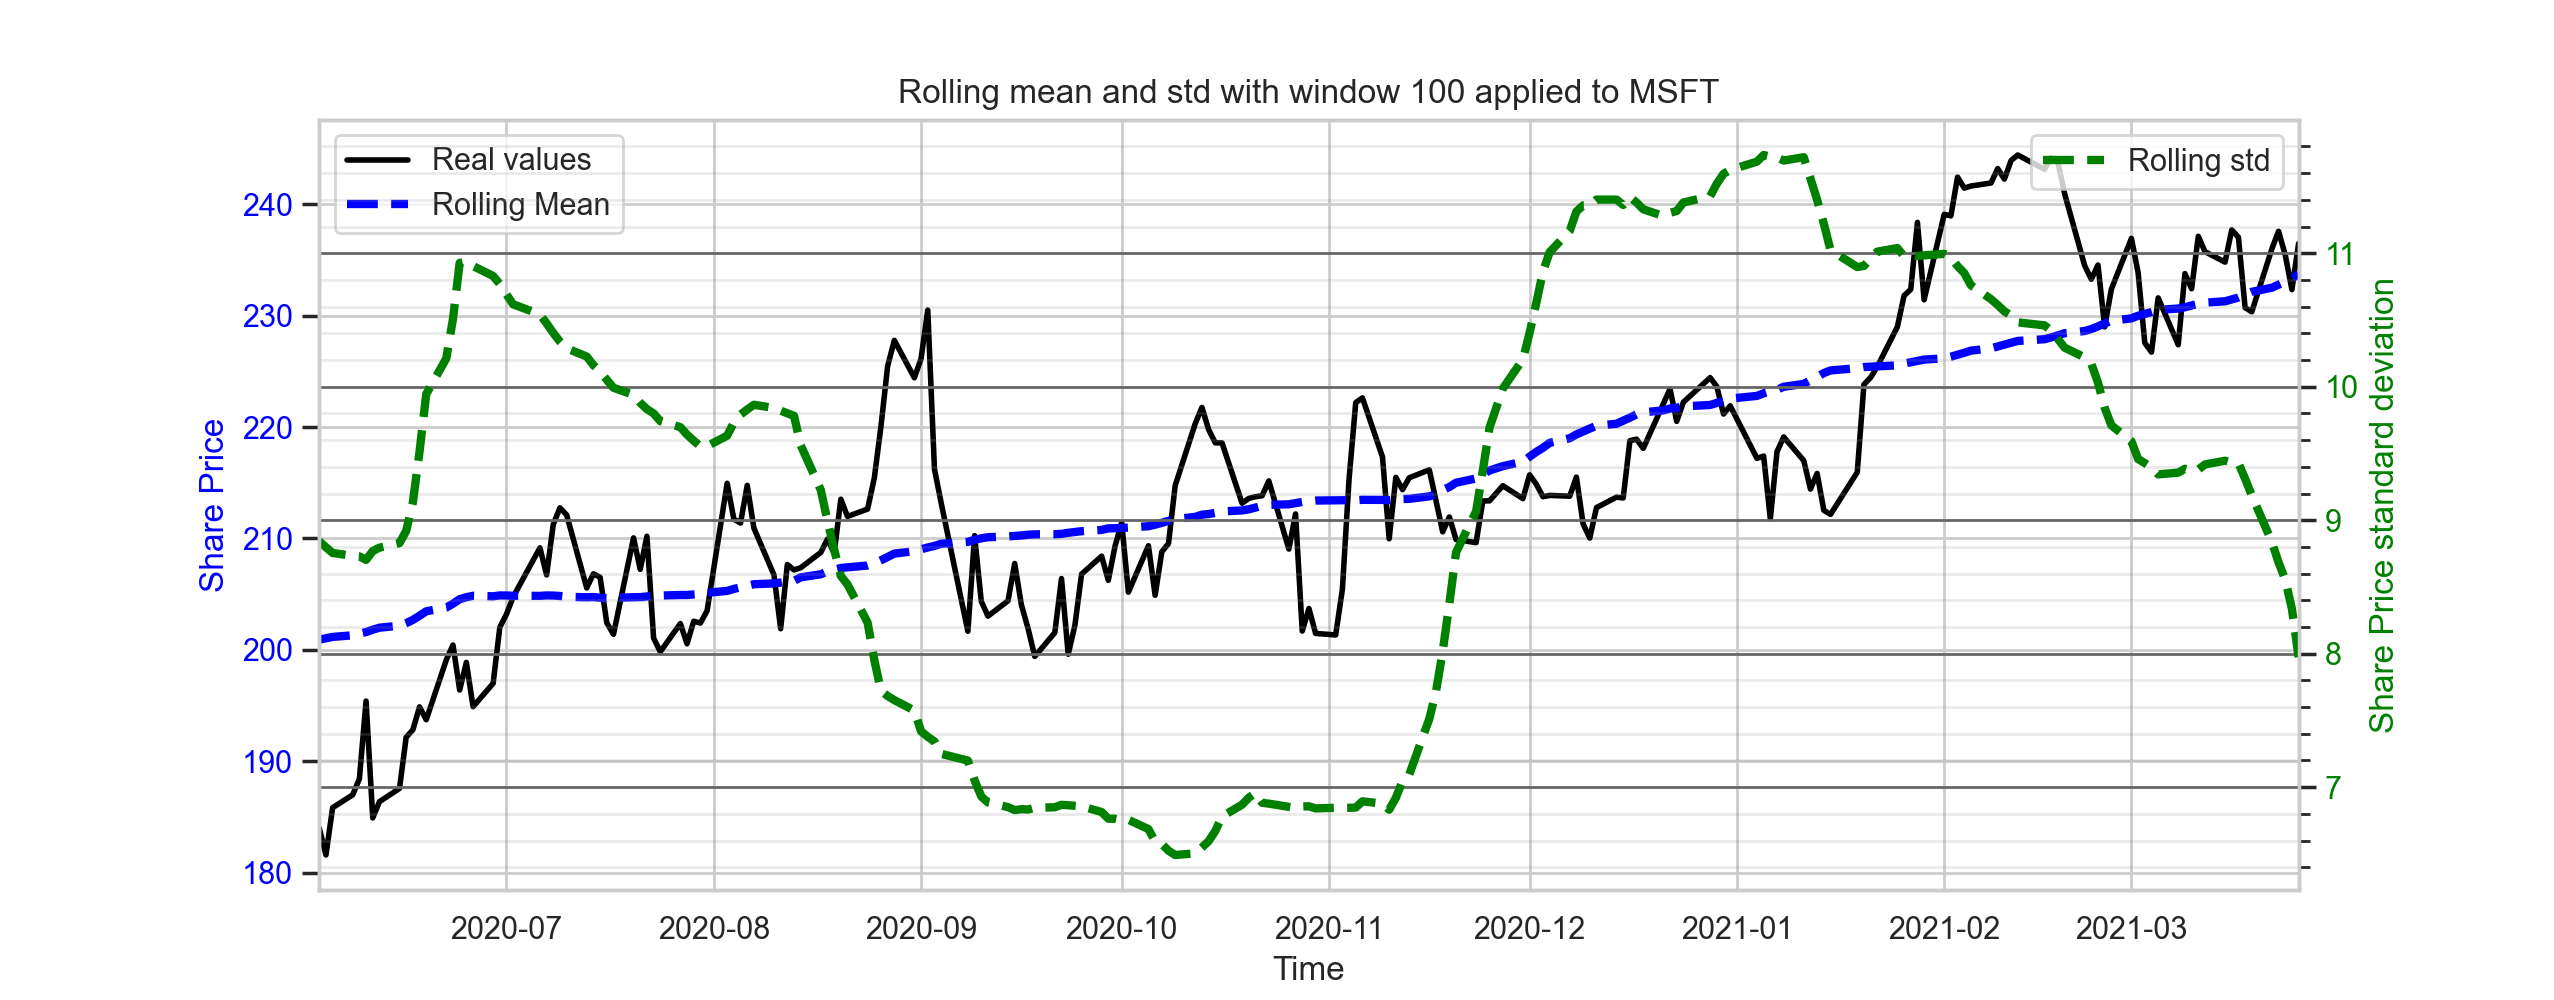
```text
usage: rolling [-w ROLLING_WINDOW]
```
Rolling mean and std deviation
* -w : rolling window. Default 100.
## decompose
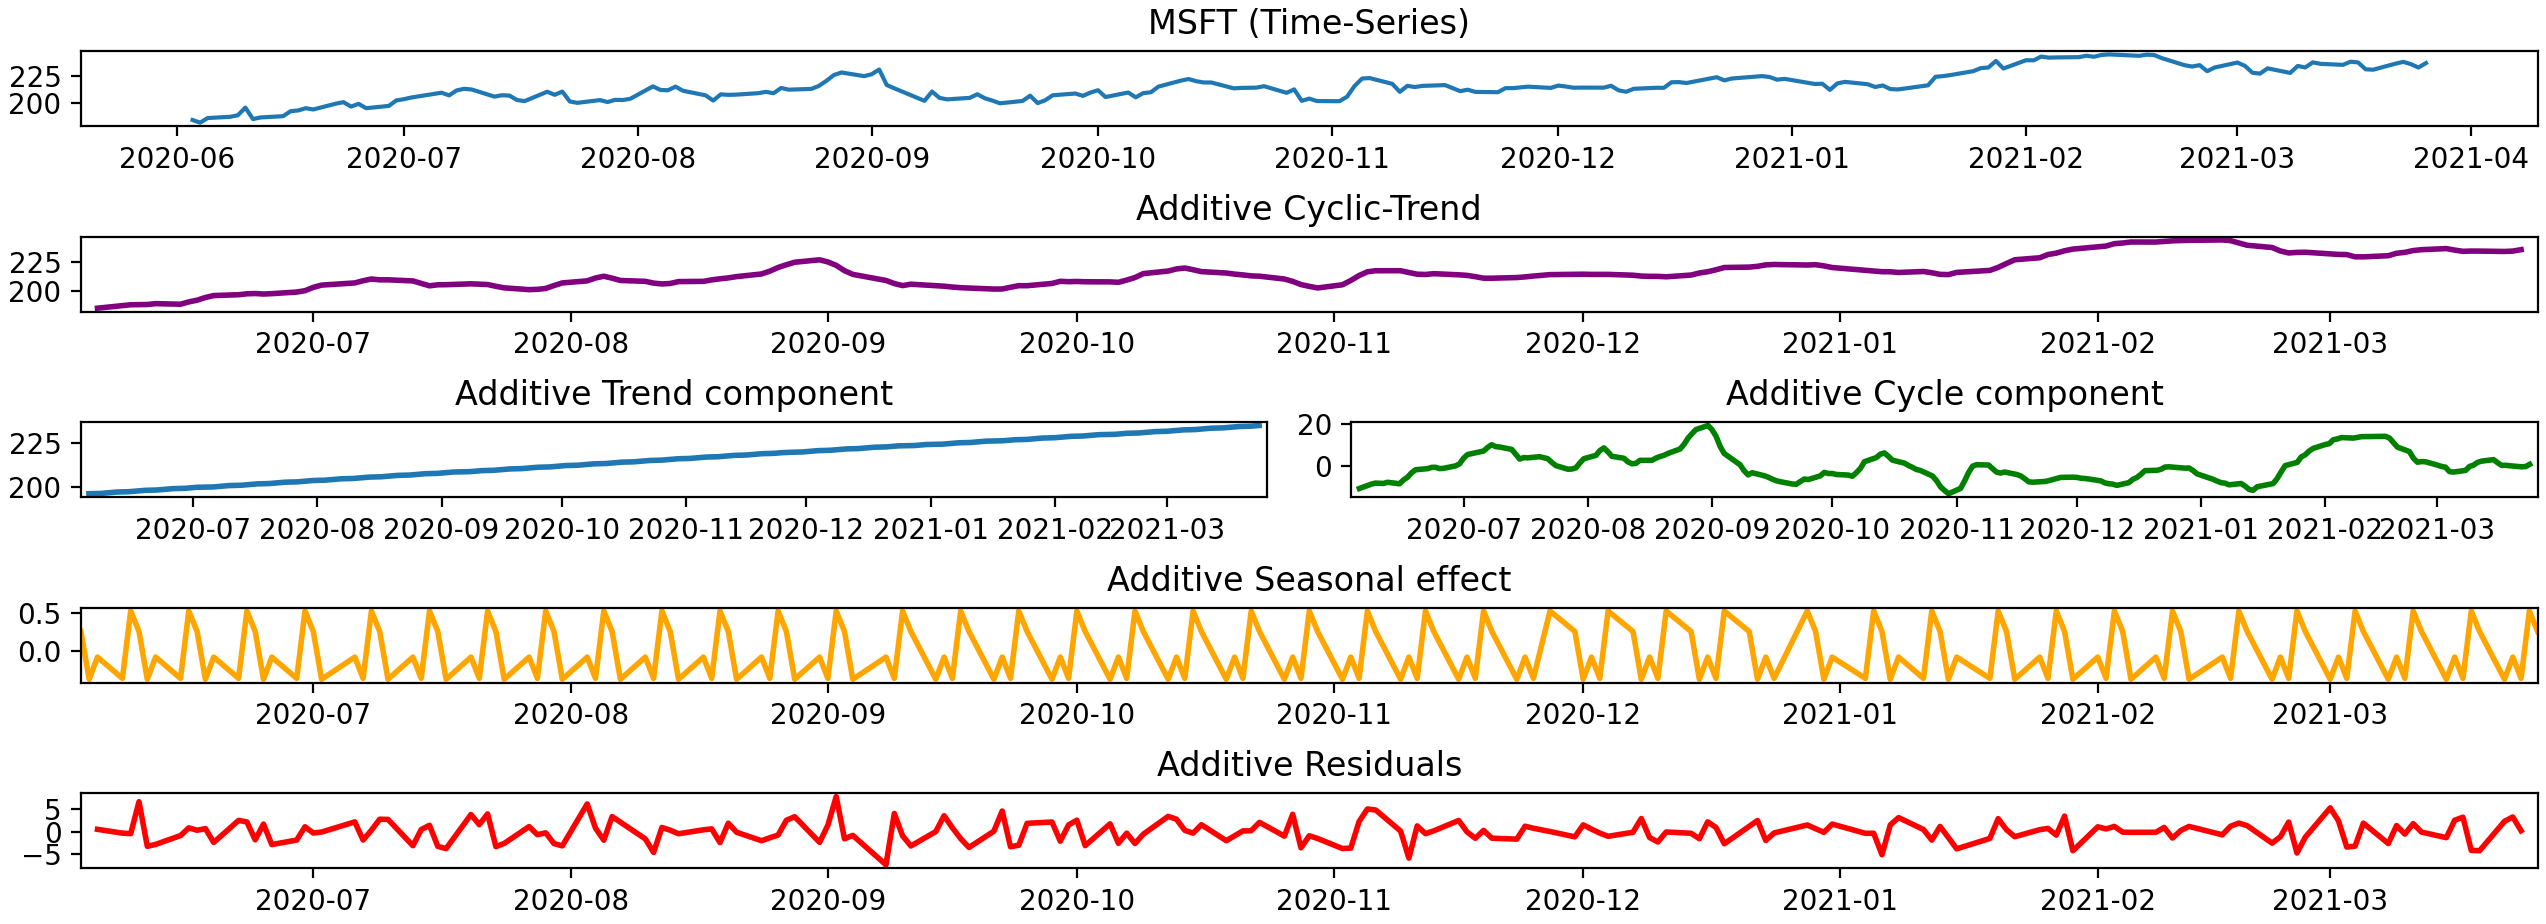
```text
usage: decompose [-m]
```
Decompose time series as:
- Additive Time Series = Level + CyclicTrend + Residual + Seasonality
- Multiplicative Time Series = Level * CyclicTrend * Residual * Seasonality
* -m : multiplicative model. Default additive.
 ## cusum
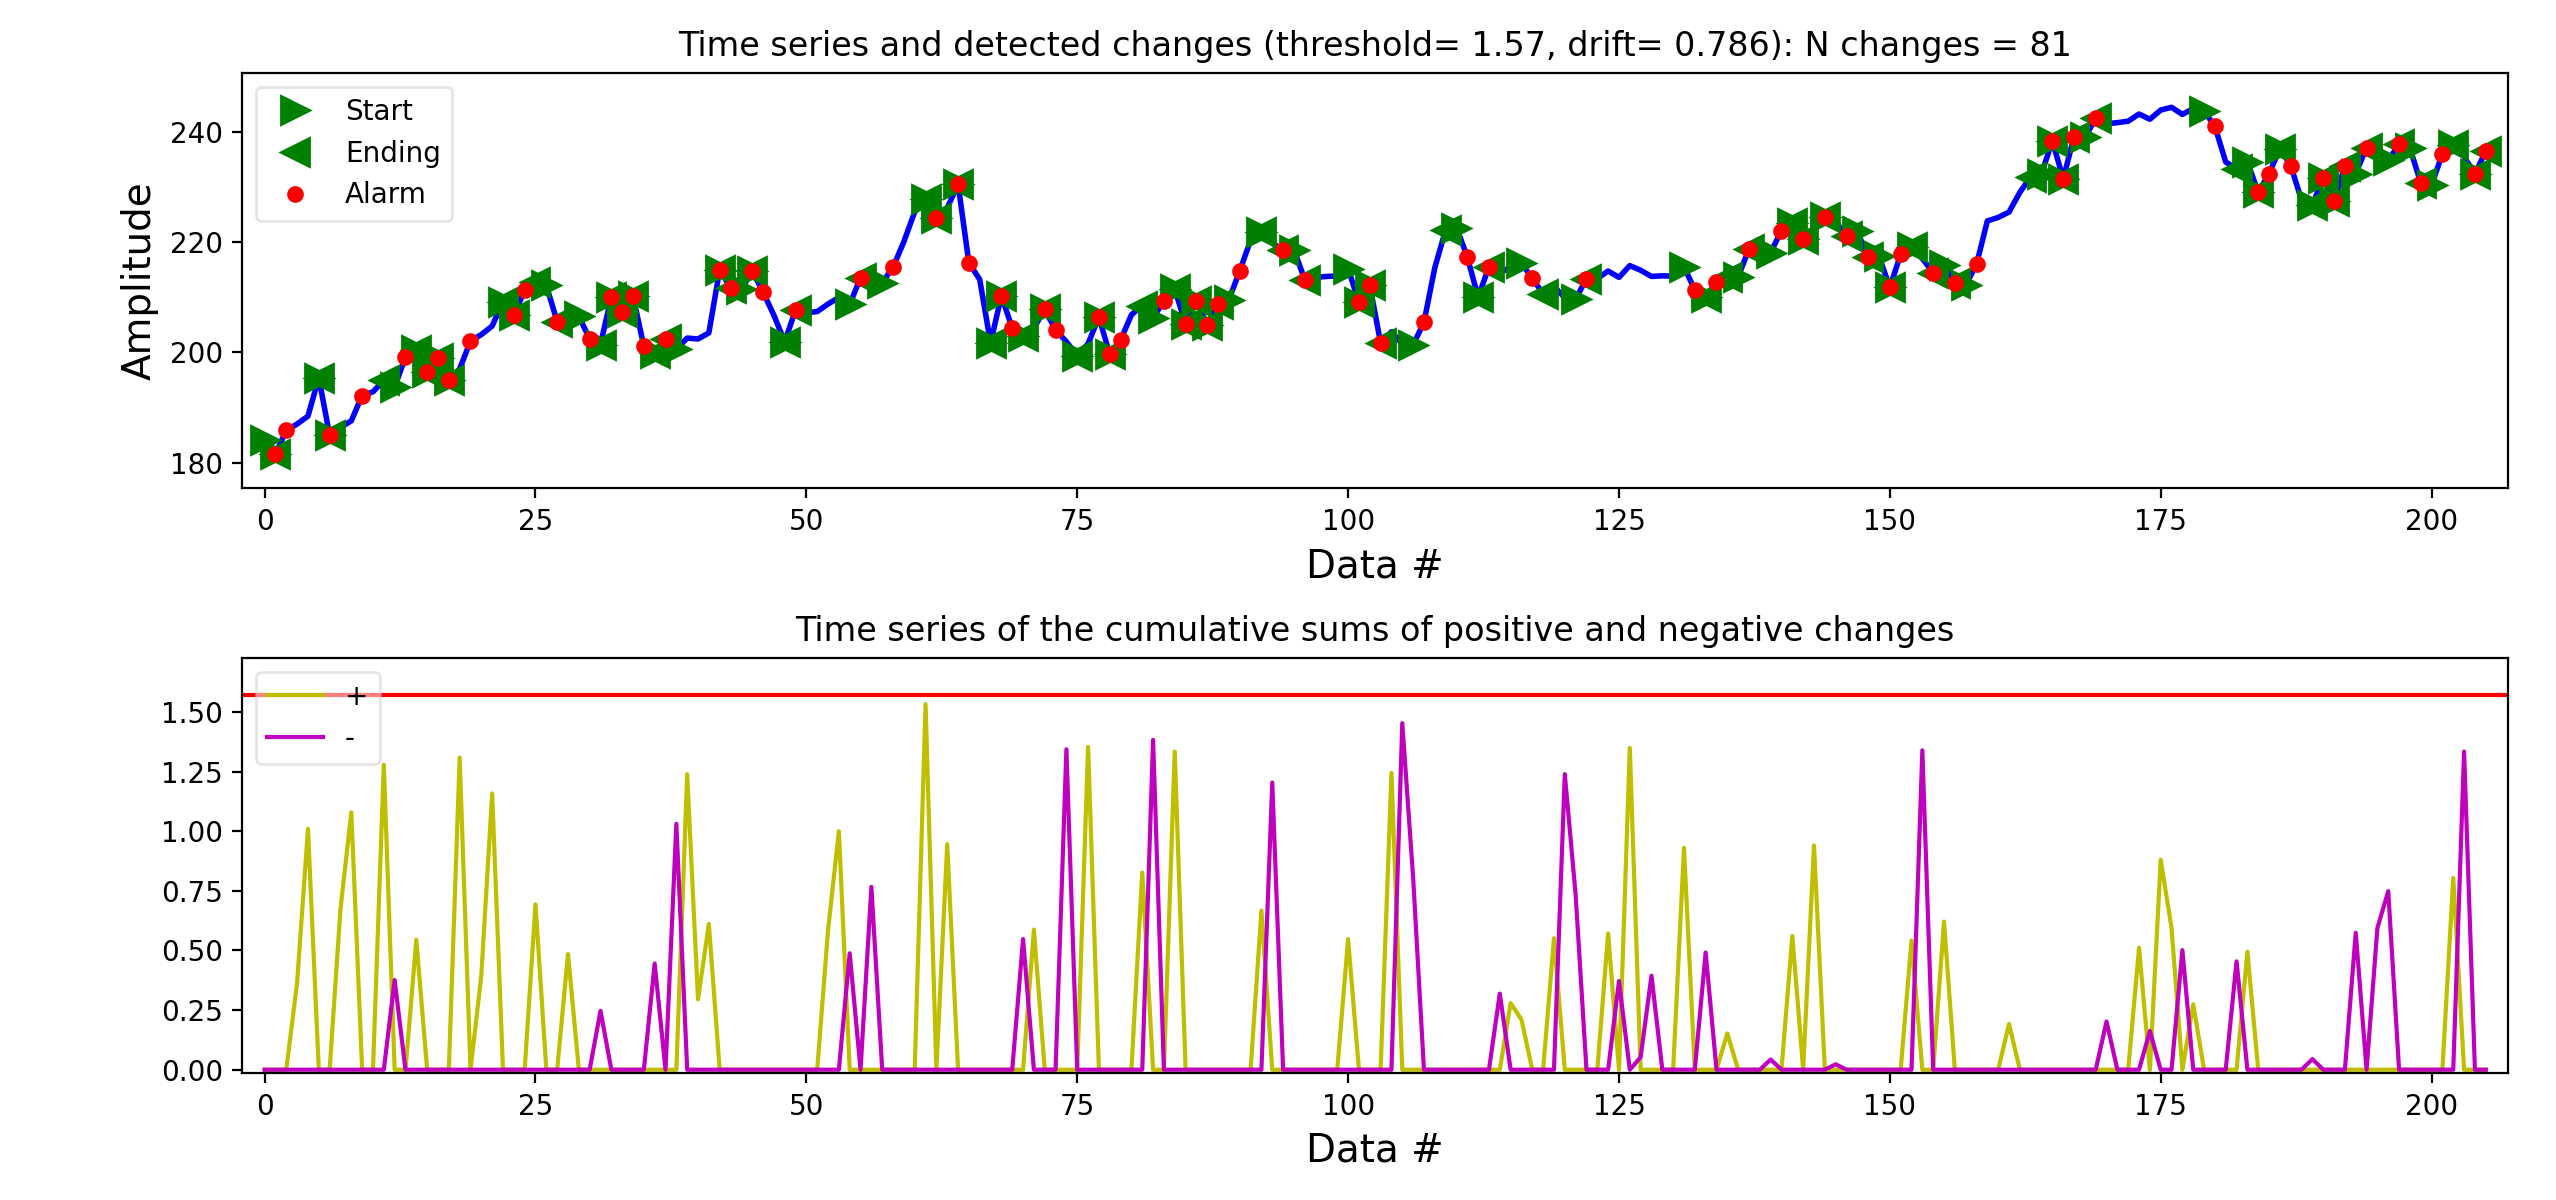
```text
usage: cusum [-t THRESHOLD] [-d DRIFT]
```
Cumulative sum algorithm (CUSUM) to detect abrupt changes in data
* -t : threshold. Default (MAX-min)/40.
* -d : drift. Default (MAX-min)/80.
## acf
```text
usage: acf [-l LAGS]
```
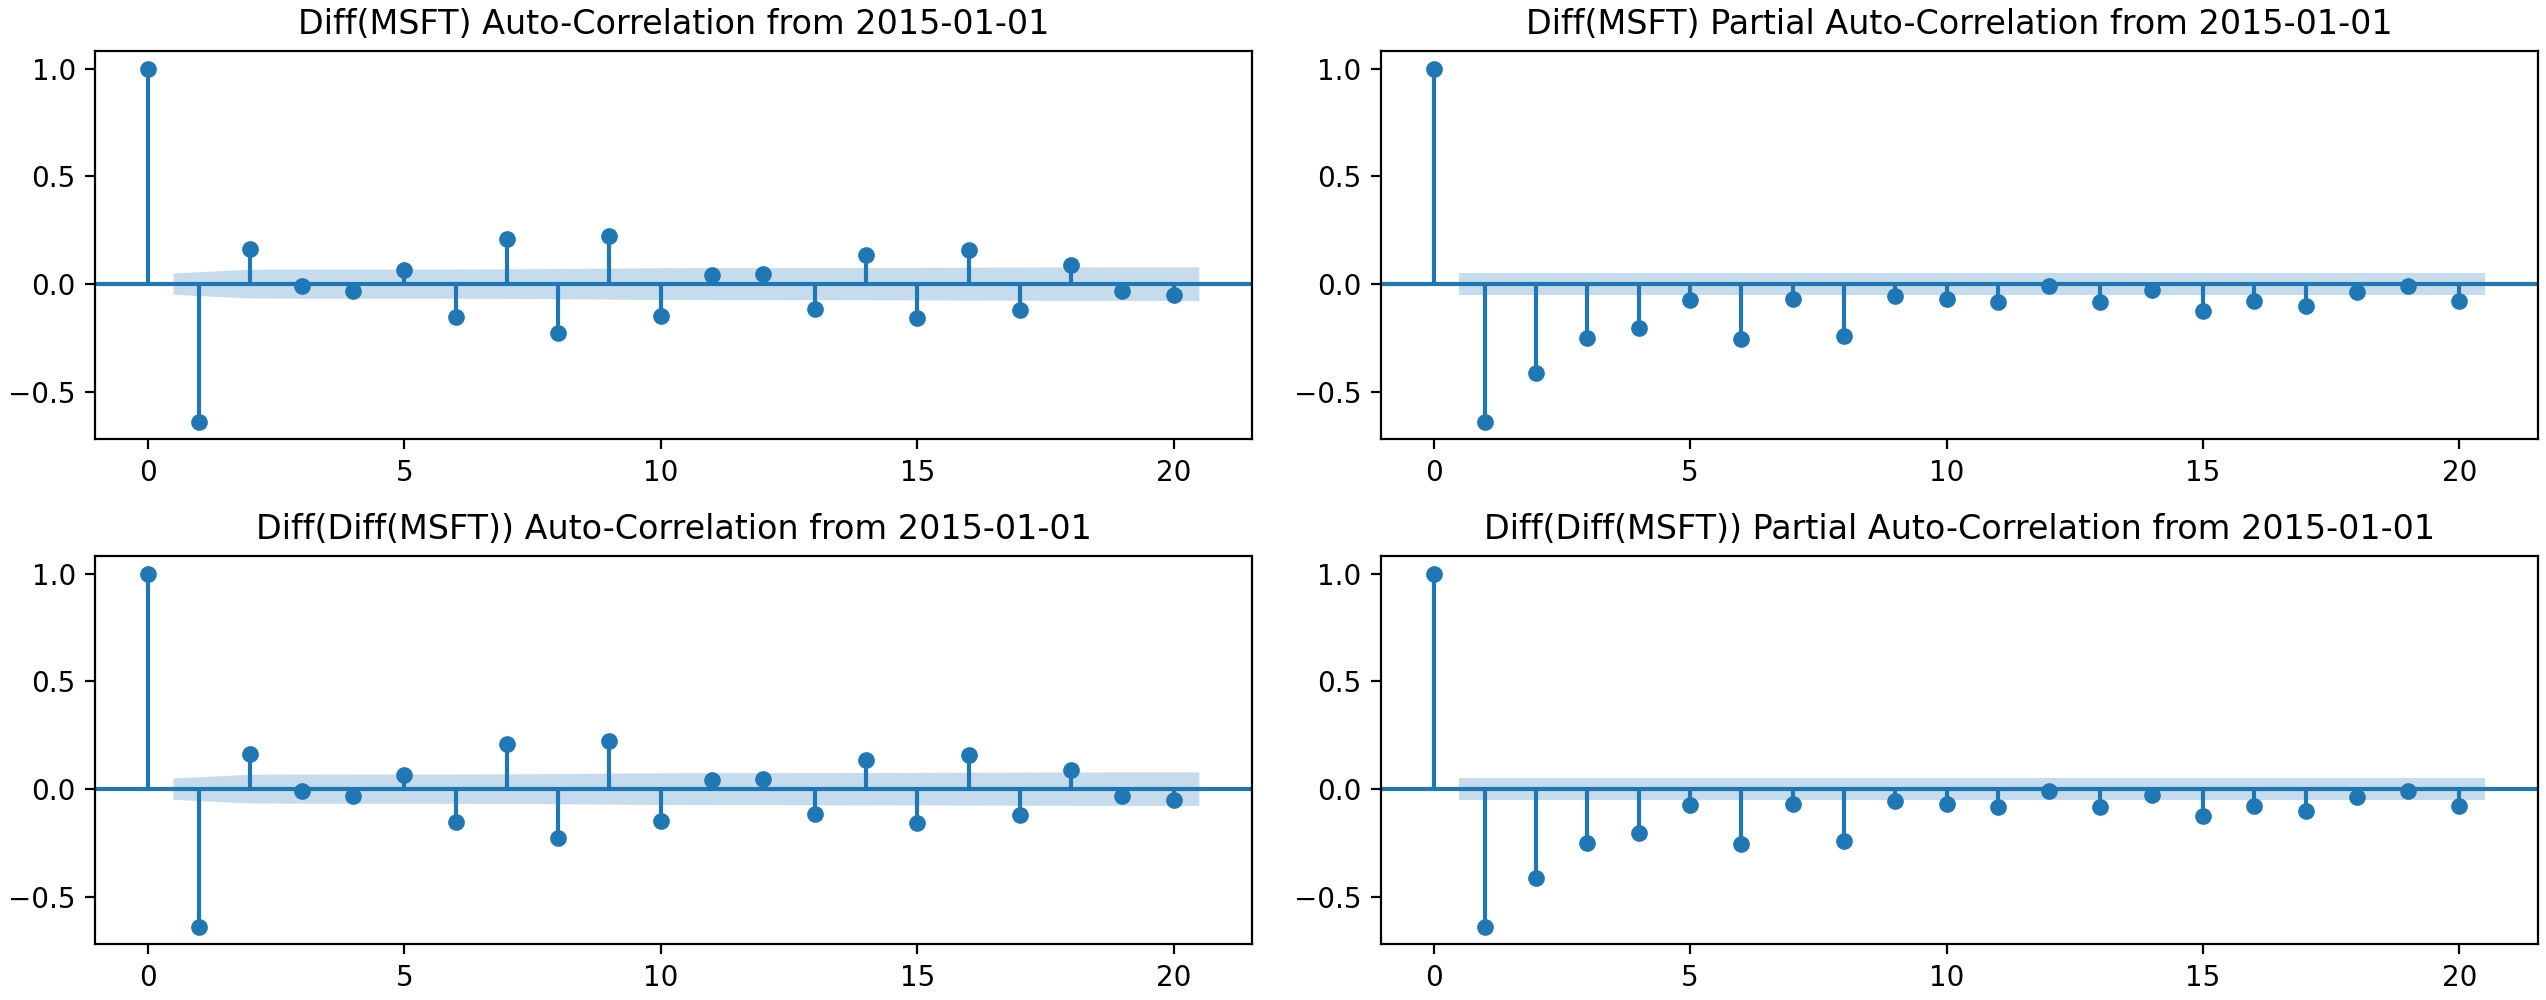
Auto-Correlation and Partial Auto-Correlation Functions for diff and diff diff stock data
* -l : maximum lags to display in plots. Default 40.