Portfolio Optimization
This menu aims to optimize a portfolio of pre-loaded stocks, and the usage of the following commands along with an example will be exploited below.
- add
- add ticker to optimize
- select
- overwrite current tickers with new tickers
- equal
- equally weighted
- mktcap
- weighted according to market cap (property marketCap)
- dividend
- weighted according to dividend yield (property dividendYield)
- property
- weight according to selected info property
- maxsharpe
- optimizes for maximal Sharpe ratio (a.k.a the tangency portfolio)
- minvol
- optimizes for minimum volatility
- maxquadutil
- maximises the quadratic utility, given some risk aversion
- effret
- maximises return for a given target risk
- effrisk
- minimises risk for a given target return
- ef
- show the efficient frontier
add
add [-t ADD_TICKERS]
Add/Select tickers for portfolio to be optimized.
- -t : Tickers to be used in the portfolio to optimize
select
select [-t ADD_TICKERS]
Add/Select tickers for portfolio to be optimized.
- -t : Tickers to be used in the portfolio to optimize
equal
equal [-v VALUE] [--pie]
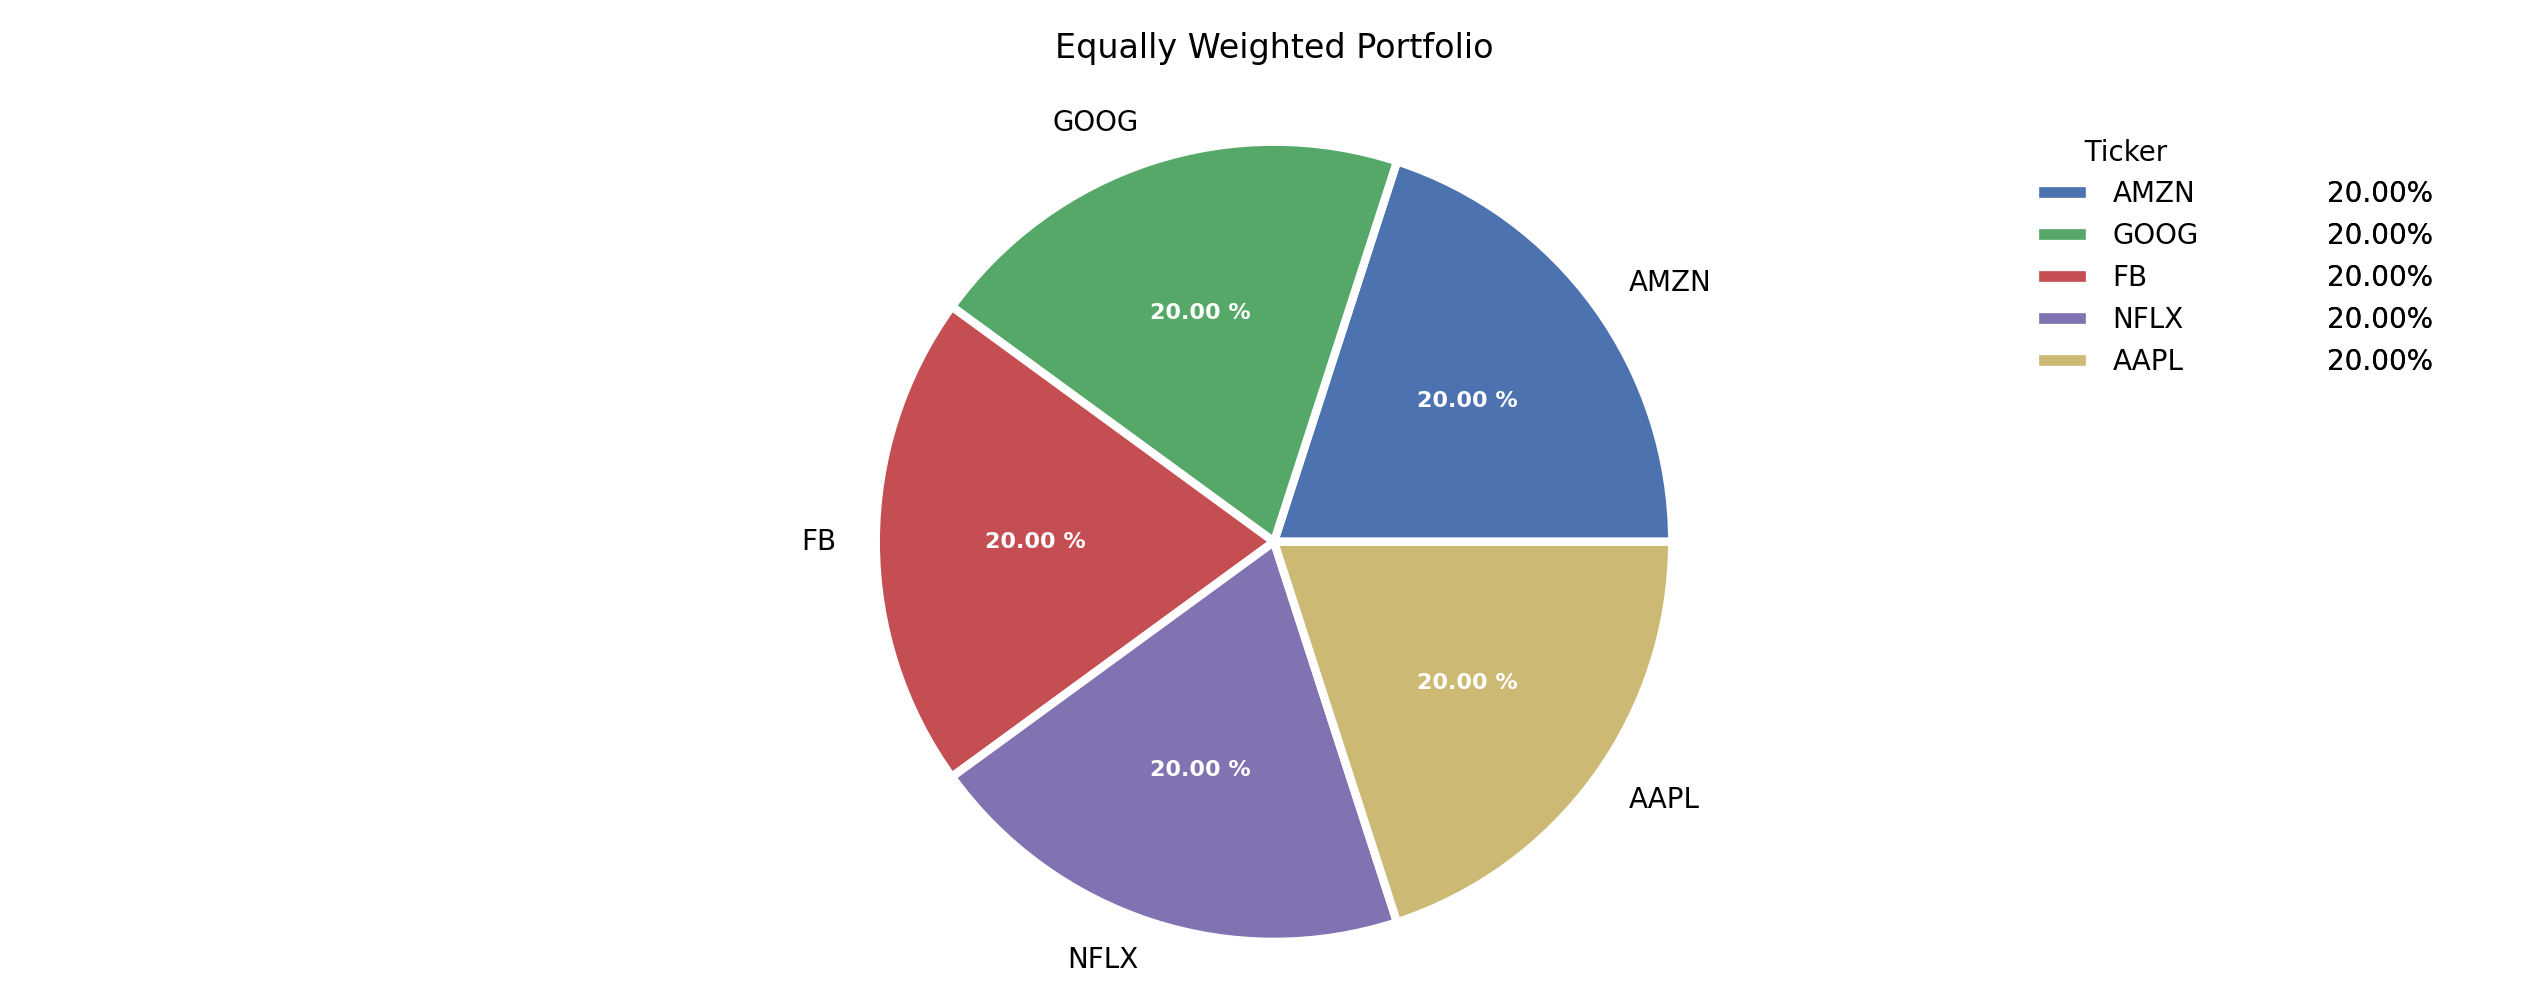
Returns an equally weighted portfolio
- -v : If provided, this represents an actual allocation amount for the portfolio. Defaults to 1, which just returns the weights.
- --pie : Display a pie chart for weights
mktcap
property -p marketCap [-v VALUE] [--pie]
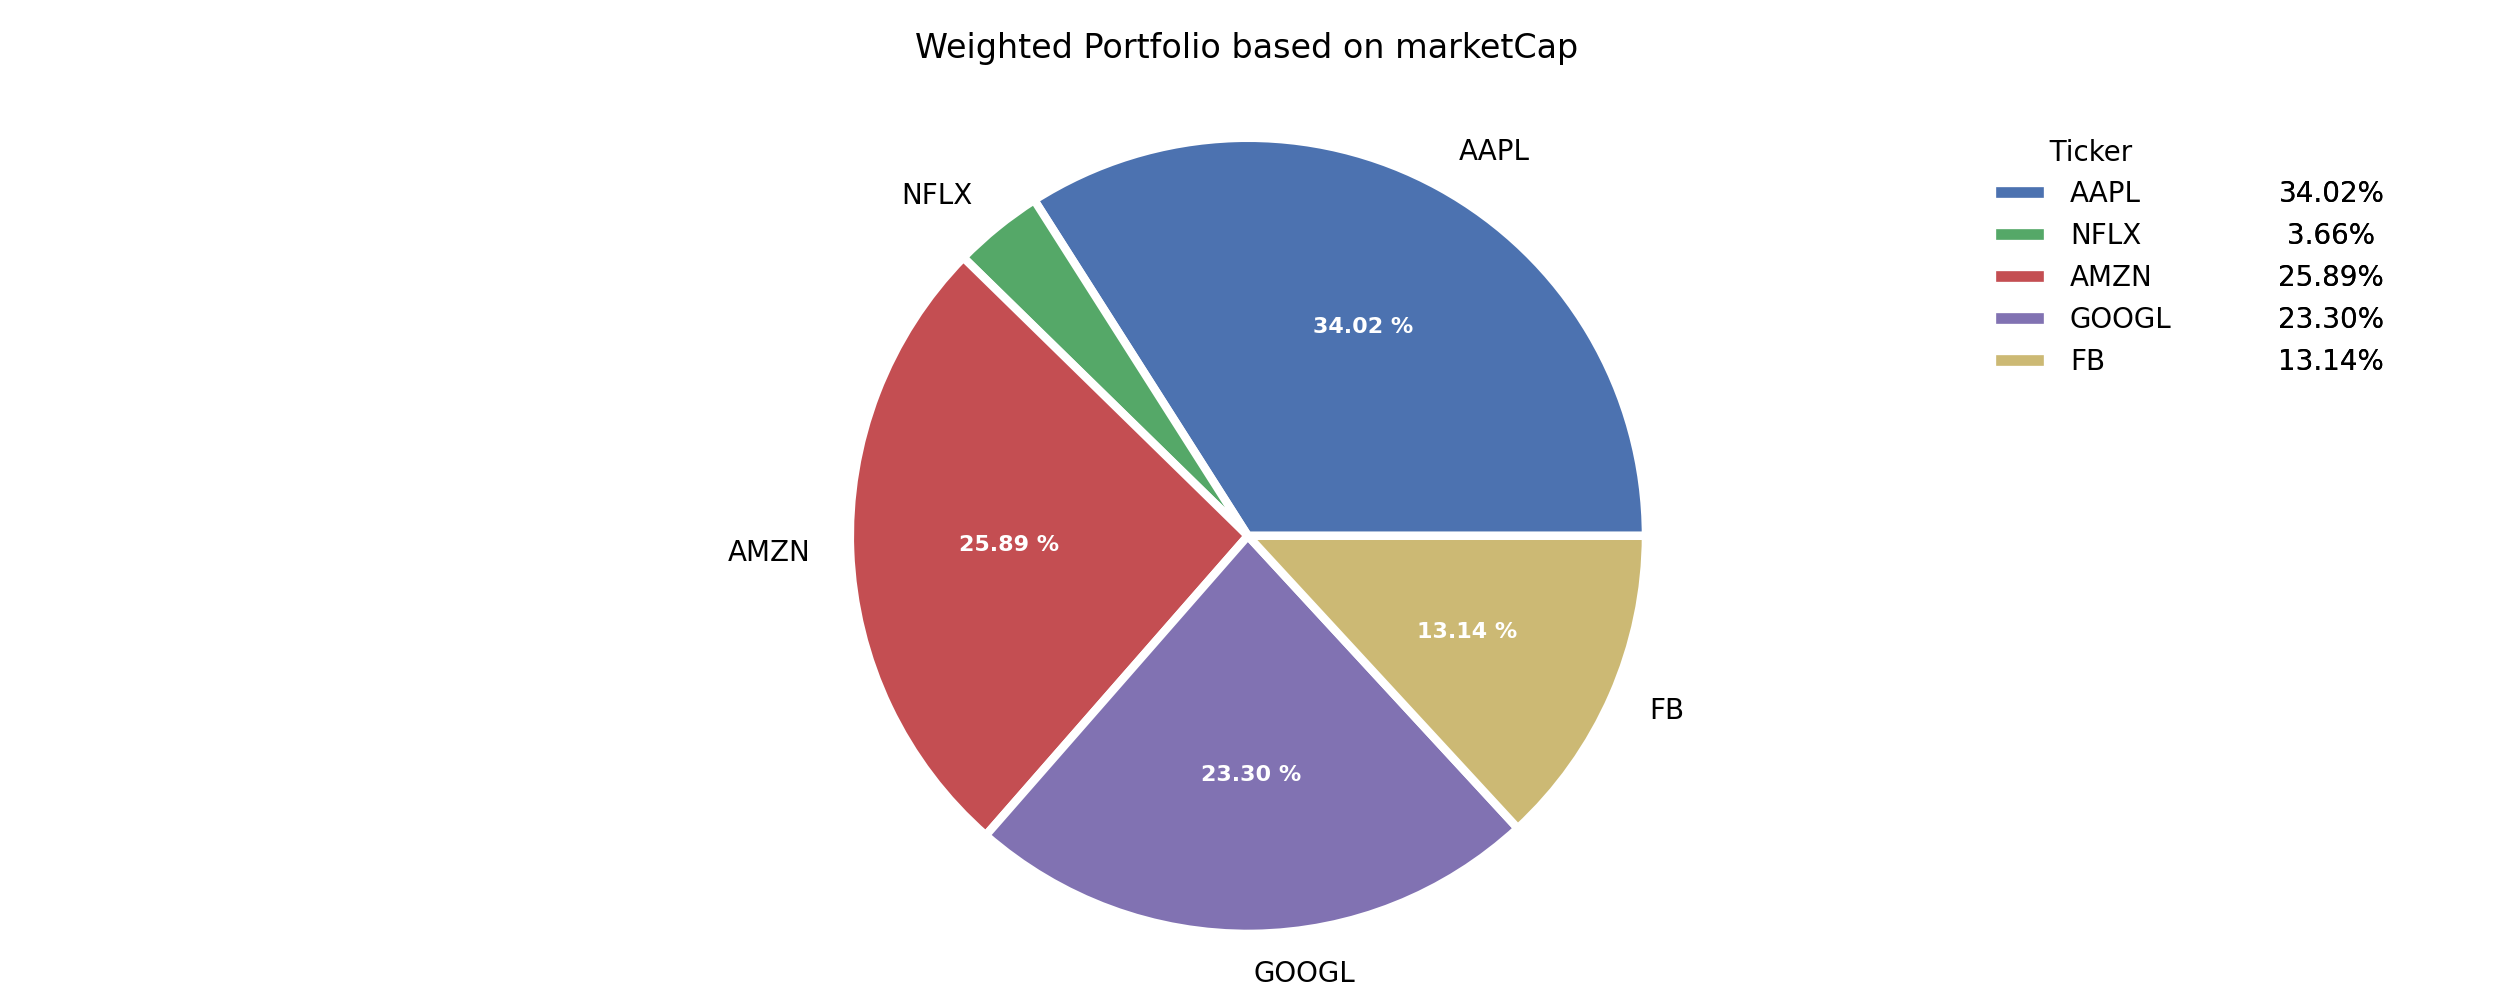
Returns a portfolio that is weighted based on market cap info
- -v : If provided, this represents an actual allocation amount for the portfolio. Defaults to 1, which just returns the weights.
- --pie : Display a pie chart for weights
dividend
property -p dividend [-v VALUE] [--pie]
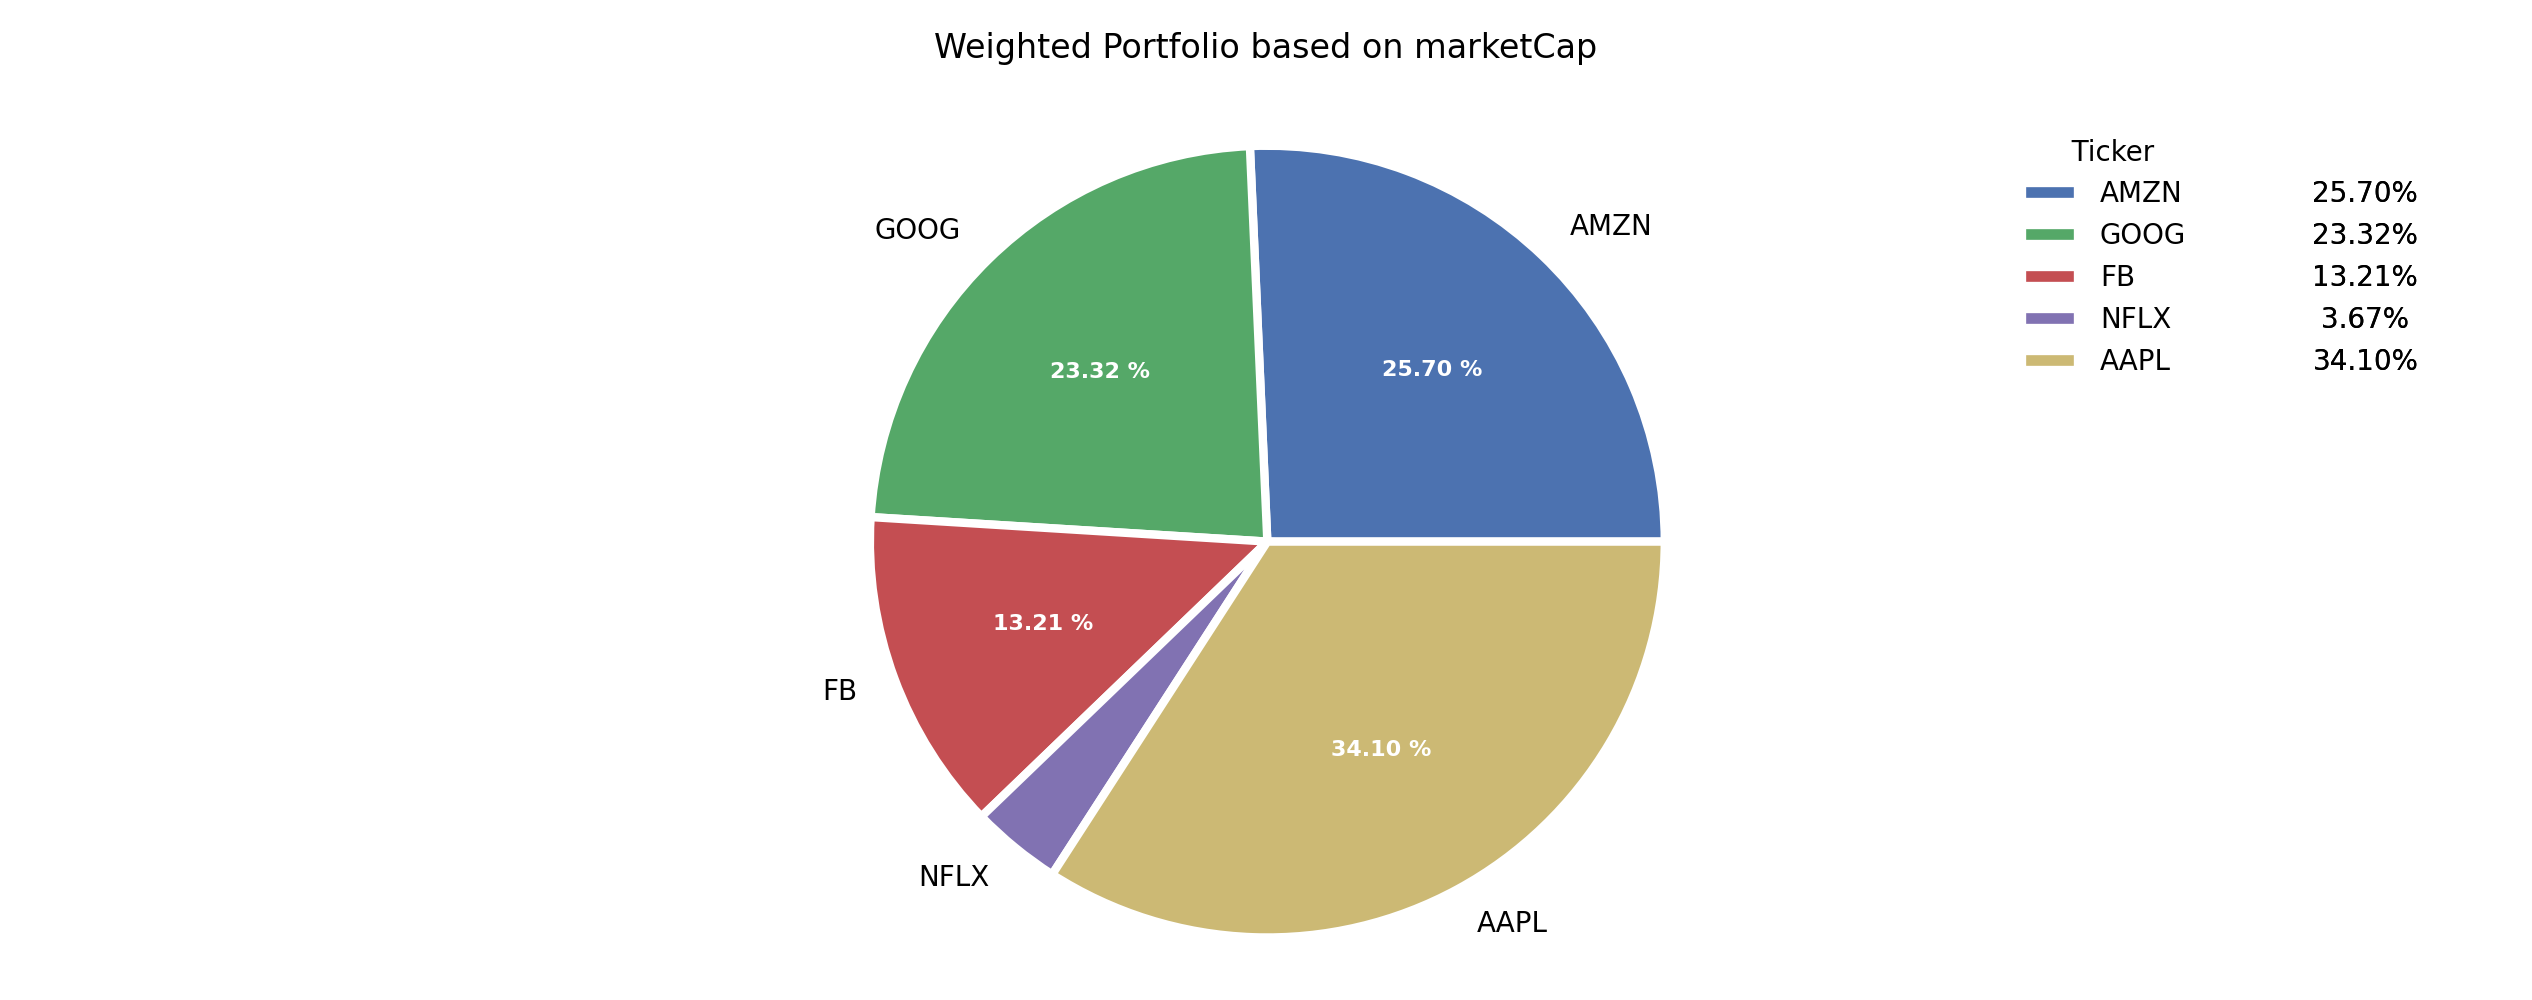
Returns a portfolio that is weighted based on dividend yield info
- -v : If provided, this represents an actual allocation amount for the portfolio. Defaults to 1, which just returns the weights.
- --pie : Display a pie chart for weights

property
property [-p PROPERTY] [-v VALUE] [--pie]
Returns a portfolio that is weighted based on a selected property info
- -p : Property info to weigh. Use one of: previousClose, regularMarketOpen, twoHundredDayAverage, trailingAnnualDividendYield, payoutRatio, volume24Hr, regularMarketDayHigh, navPrice, averageDailyVolume10Day, totalAssets, regularMarketPreviousClose, fiftyDayAverage, trailingAnnualDividendRate, open, toCurrency, averageVolume10days, expireDate, yield, algorithm, dividendRate, exDividendDate, beta, circulatingSupply, regularMarketDayLow, priceHint, currency, trailingPE, regularMarketVolume, lastMarket, maxSupply, openInterest, marketCap, volumeAllCurrencies, strikePrice, averageVolume, priceToSalesTrailing12Months, dayLow, ask, ytdReturn, askSize, volume, fiftyTwoWeekHigh, forwardPE, fromCurrency, fiveYearAvgDividendYield, fiftyTwoWeekLow, bid, dividendYield, bidSize, dayHigh, annualHoldingsTurnover, enterpriseToRevenue, beta3Year, profitMargins, enterpriseToEbitda, 52WeekChange, morningStarRiskRating, forwardEps, revenueQuarterlyGrowth, sharesOutstanding, fundInceptionDate, annualReportExpenseRatio, bookValue, sharesShort, sharesPercentSharesOut, fundFamily, lastFiscalYearEnd, heldPercentInstitutions, netIncomeToCommon, trailingEps, lastDividendValue, SandP52WeekChange, priceToBook, heldPercentInsiders, shortRatio, sharesShortPreviousMonthDate, floatShares, enterpriseValue, threeYearAverageReturn, lastSplitFactor, legalType, lastDividendDate, morningStarOverallRating, earningsQuarterlyGrowth, pegRatio, lastCapGain, shortPercentOfFloat, sharesShortPriorMonth, impliedSharesOutstanding, fiveYearAverageReturn, and regularMarketPrice.
- -v : If provided, this represents an actual allocation amount for the portfolio. Defaults to 1, which just returns the weights.
- --pie : Display a pie chart for weights
Mean Variance Optimization
These approaches are based off of the efficient frontier approach, which is meant to solve the following optimization problem.
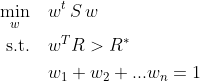
- Where S is the covariance matrix between stocks and R is the expected returns.
- The condition that all weights add up to 1 just implies that you want to have a net long portfolio (with no margin).
- A long-short portfolio can have negative weights and usually wants to have everything add up to 0 for a market-neutral strategy.
Currently, we do not allow for changing risk models or adding constraints.
If there is something specific, please submit a feature request, or if you can write it, feel free to add a PR!
All of these commands use PyPortFolioOpt package.
maxsharpe
usage: max_sharpe [-p {1d,5d,1mo,3mo,6mo,1y,2y,5y,10y,ytd,max}] [-v VALUE] [--pie] [-r RISK_FREE_RATE]
Maximise the Sharpe Ratio. The result is also referred to as the tangency portfolio, as it is the portfolio for which the capital market line is tangent to the efficient frontier. This is a convex optimization problem after making a certain variable substitution. See Cornuejols and Tutuncu (2006) http://web.math.ku.dk/~rolf/CT_FinOpt.pdf for more. The sharpe ratio is defined as (Mean Returns - Risk Free Rate)/(Standard Deviation of Returns).
- -p : Amount of time to retrieve data from yfinance. Default: 3mo.
- -v : If provided, this represents an actual allocation amount for the portfolio. Defaults to 1, which just returns the weights.
- --pie : Display a pie chart for weights

minvol
usage: minvol [-p {1d,5d,1mo,3mo,6mo,1y,2y,5y,10y,ytd,max}] [-v VALUE] [--pie]
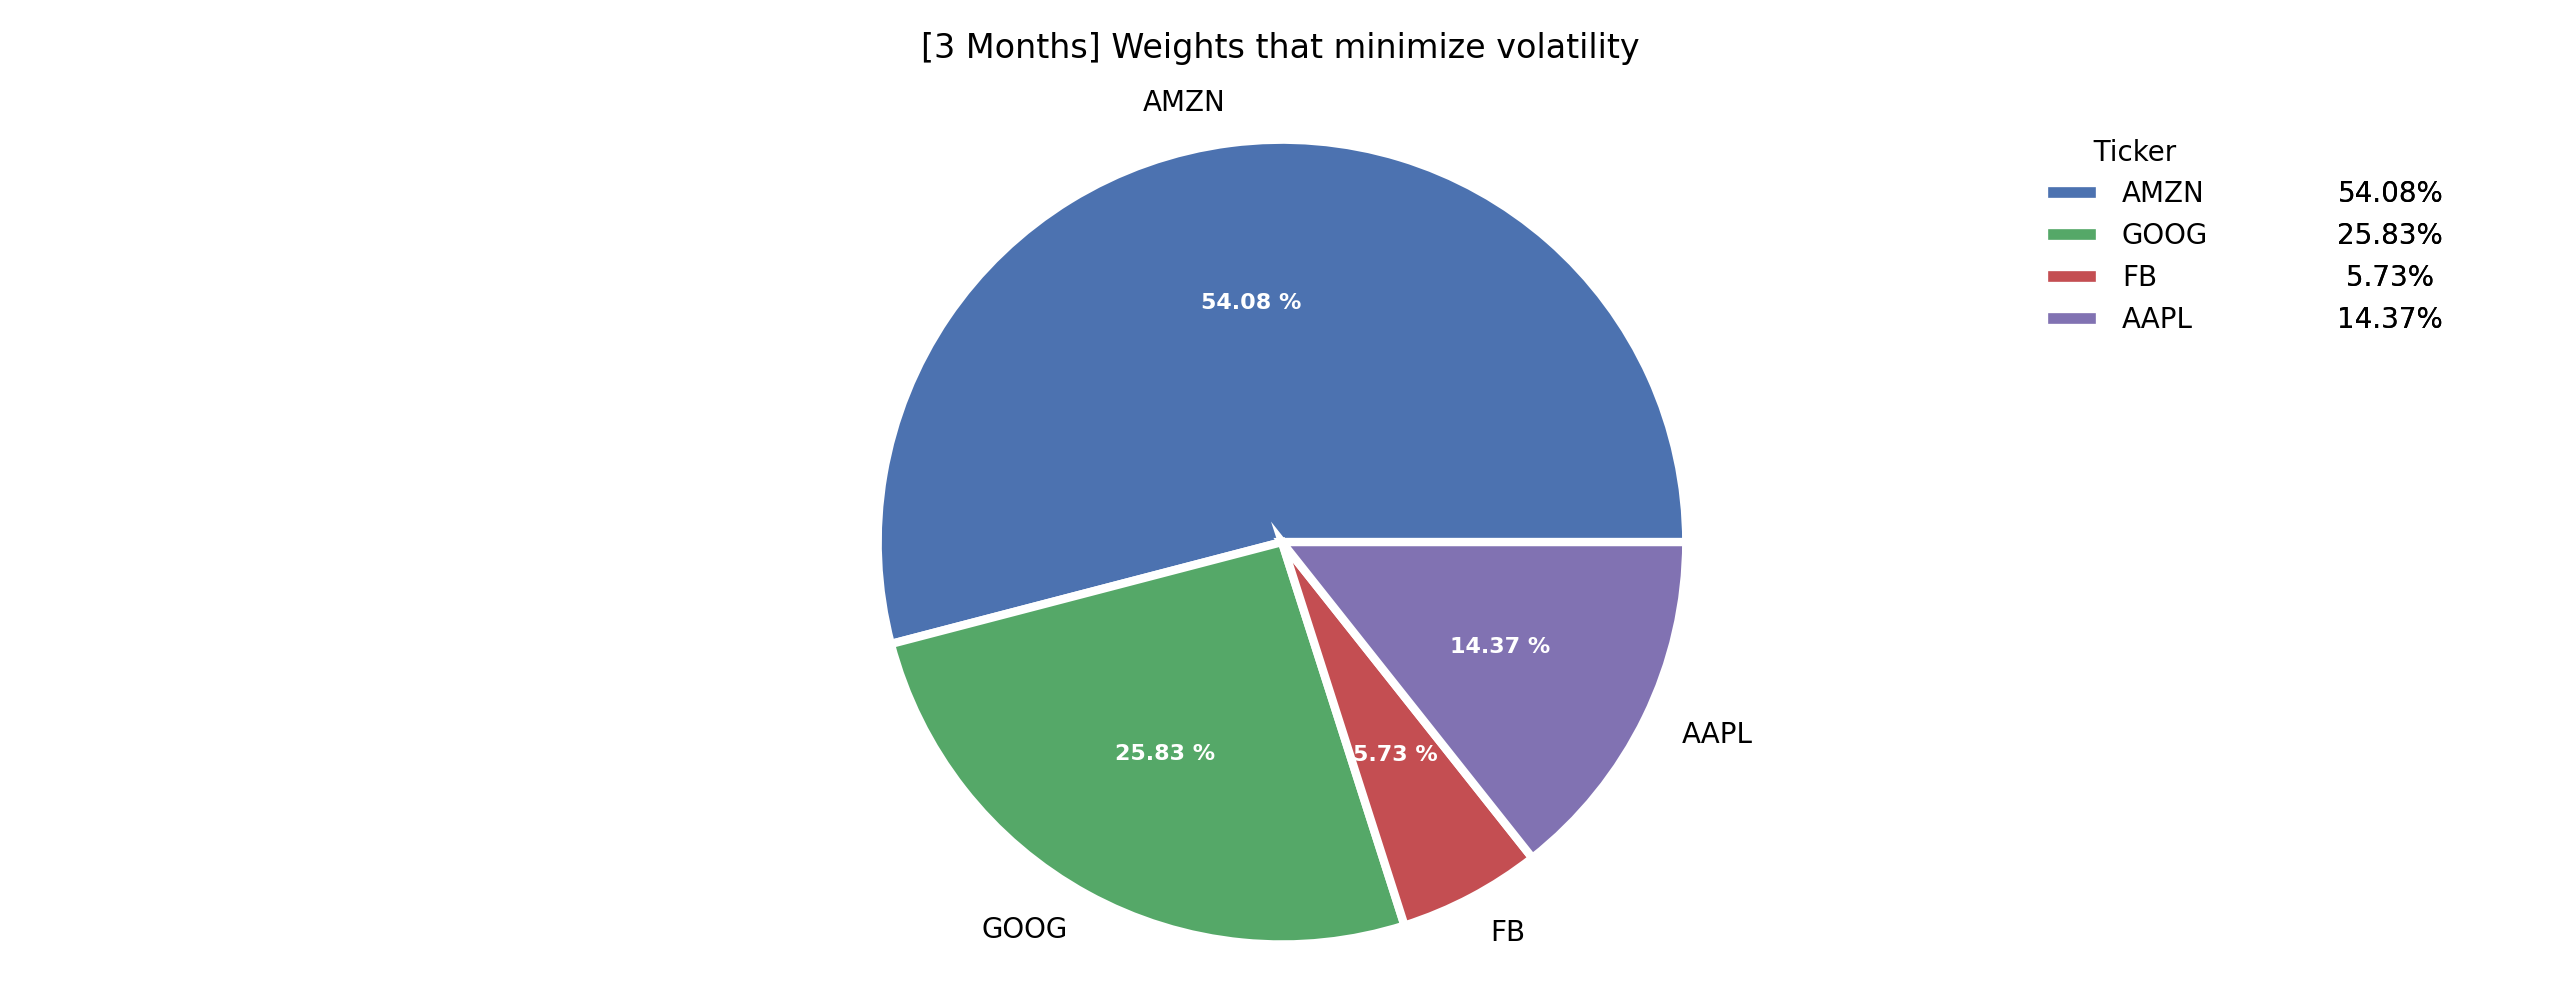
This portfolio minimizes the total volatility, which also means it has the smallest returns among the efficient frontier.
- -p : Amount of time to retrieve data from yfinance. Default: 3mo.
- -v : If provided, this represents an actual allocation amount for the portfolio. Defaults to 1, which just returns the weights.
- --pie : Display a pie chart for weights

maxquadutil
usage: maxquadutil [-p {1d,5d,1mo,3mo,6mo,1y,2y,5y,10y,ytd,max}] [-v VALUE] [--pie] [-r RISK_AVERSION] [-n]
Maximises the quadratic utility, given some risk aversion.
- -p : Amount of time to retrieve data from yfinance. Default: 3mo.
- -v : If provided, this represents an actual allocation amount for the portfolio. Defaults to 1, which just returns the weights.
- --pie : Display a pie chart for weights
- -r : Risk aversion parameter
- -n : Whether the portfolio should be market neutral (weights sum to zero). Defaults: False.

effret
usage: effret [-p {1d,5d,1mo,3mo,6mo,1y,2y,5y,10y,ytd,max}] [-v VALUE] [--pie] [-t TARGET_RETURN] [-n]
Calculate the 'Markowitz portfolio', minimising volatility for a given target return.
- -p : Amount of time to retrieve data from yfinance. Default: 3mo.
- -v : If provided, this represents an actual allocation amount for the portfolio. Defaults to 1, which just returns the weights.
- --pie : Display a pie chart for weights
- -t : The desired return of the resulting portfolio
- -n : Whether the portfolio should be market neutral (weights sum to zero). Defaults: False.

effrisk
usage: effrisk [-p {1d,5d,1mo,3mo,6mo,1y,2y,5y,10y,ytd,max}] [-v VALUE] [--pie] [-t TARGET_VOLATILITY] [-n]
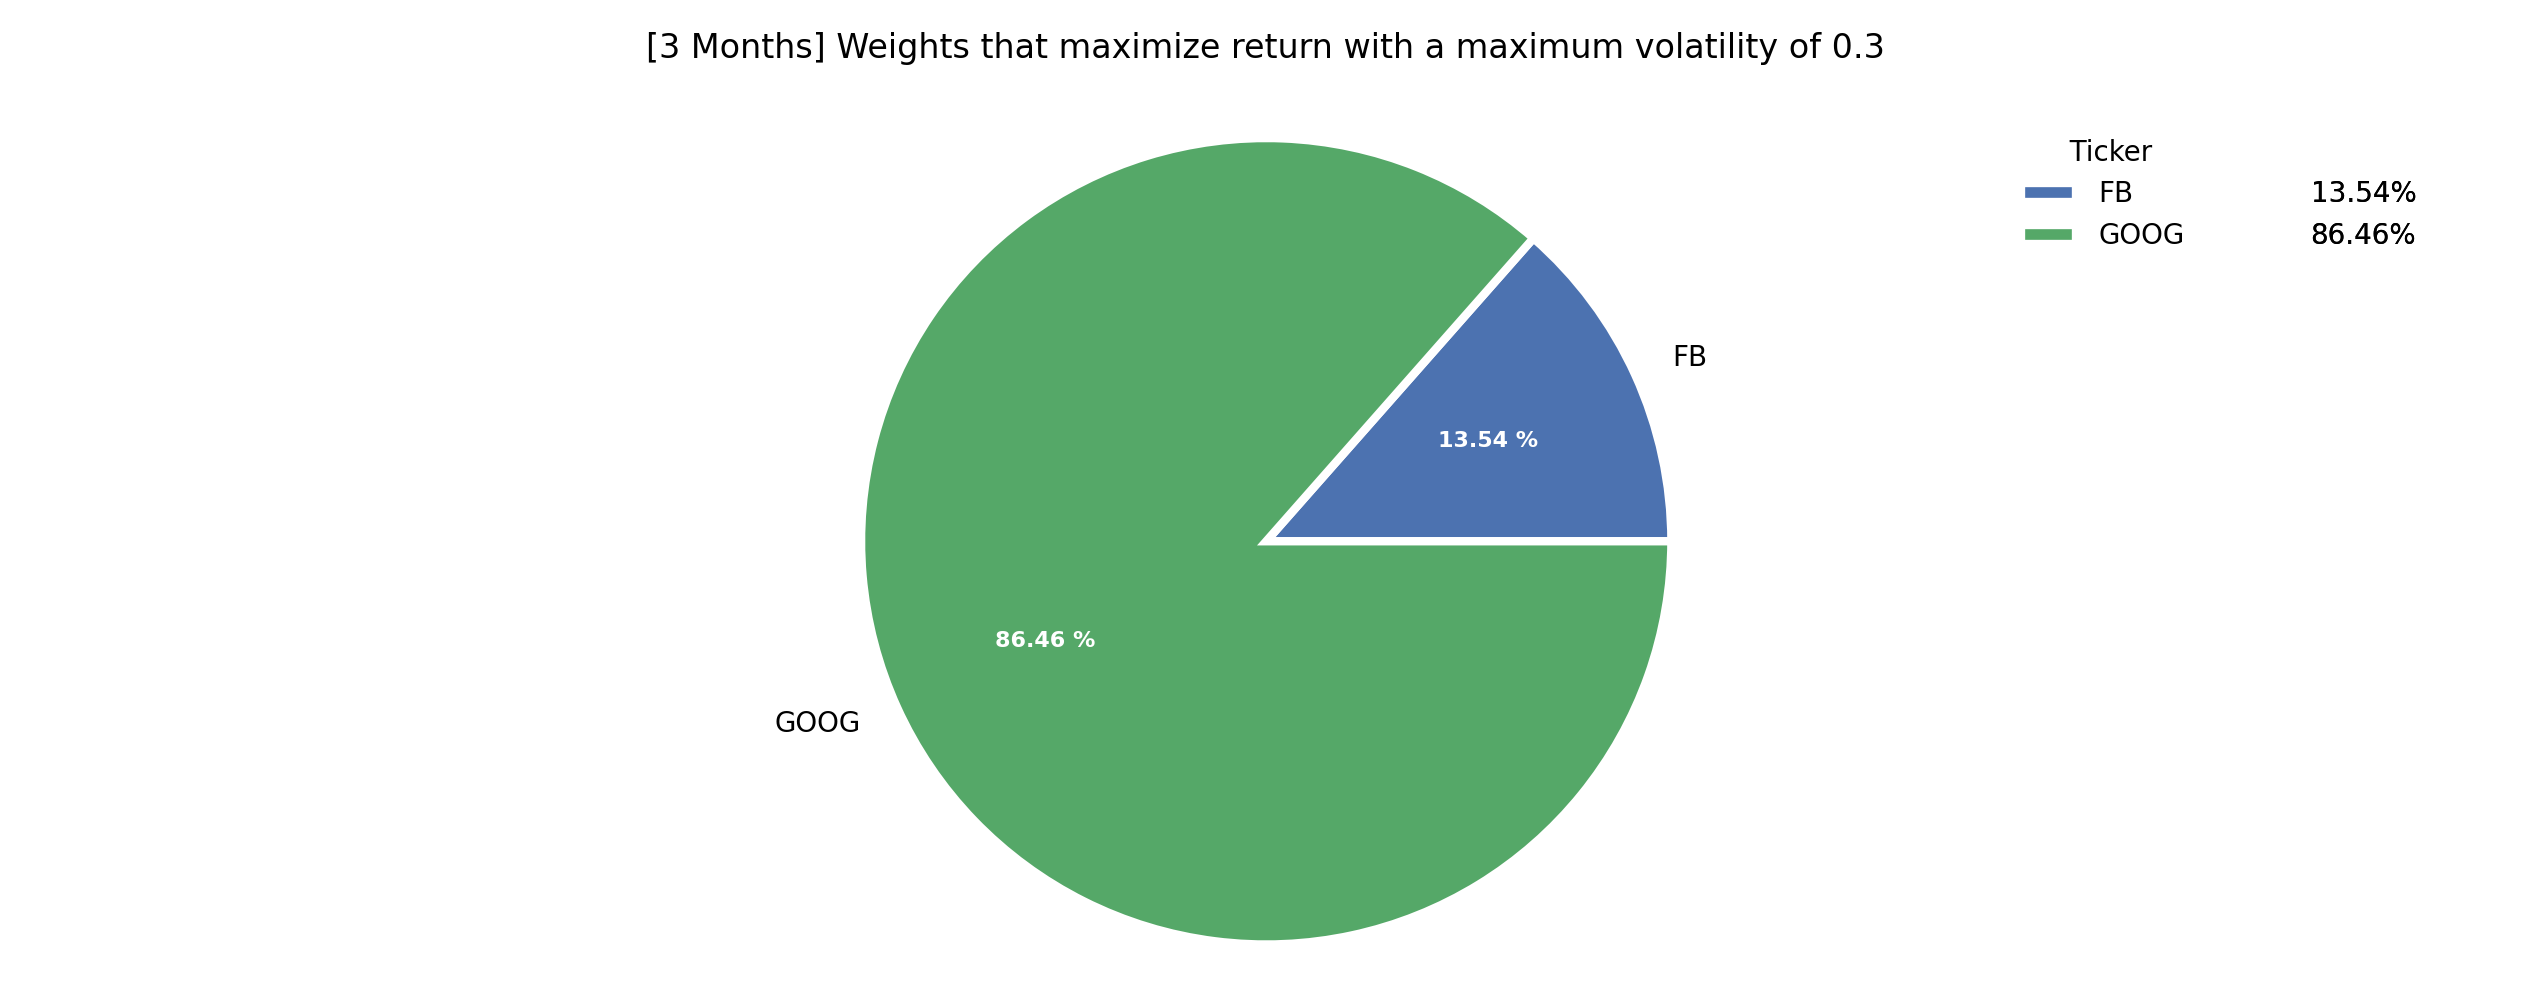
Maximise return for a target risk. The resulting portfolio will have a volatility less than the target (but not guaranteed to be equal).
- -p : Amount of time to retrieve data from yfinance. Default: 3mo.
- -v : If provided, this represents an actual allocation amount for the portfolio. Defaults to 1, which just returns the weights.
- --pie : Display a pie chart for weights
- -t : The desired maximum volatility of the resultingportfolio
- -n : Whether the portfolio should be market neutral (weights sum to zero). Defaults: False.

ef
usage: ef [-p {1d,5d,1mo,3mo,6mo,1y,2y,5y,10y,ytd,max}] [-n N_PORT]
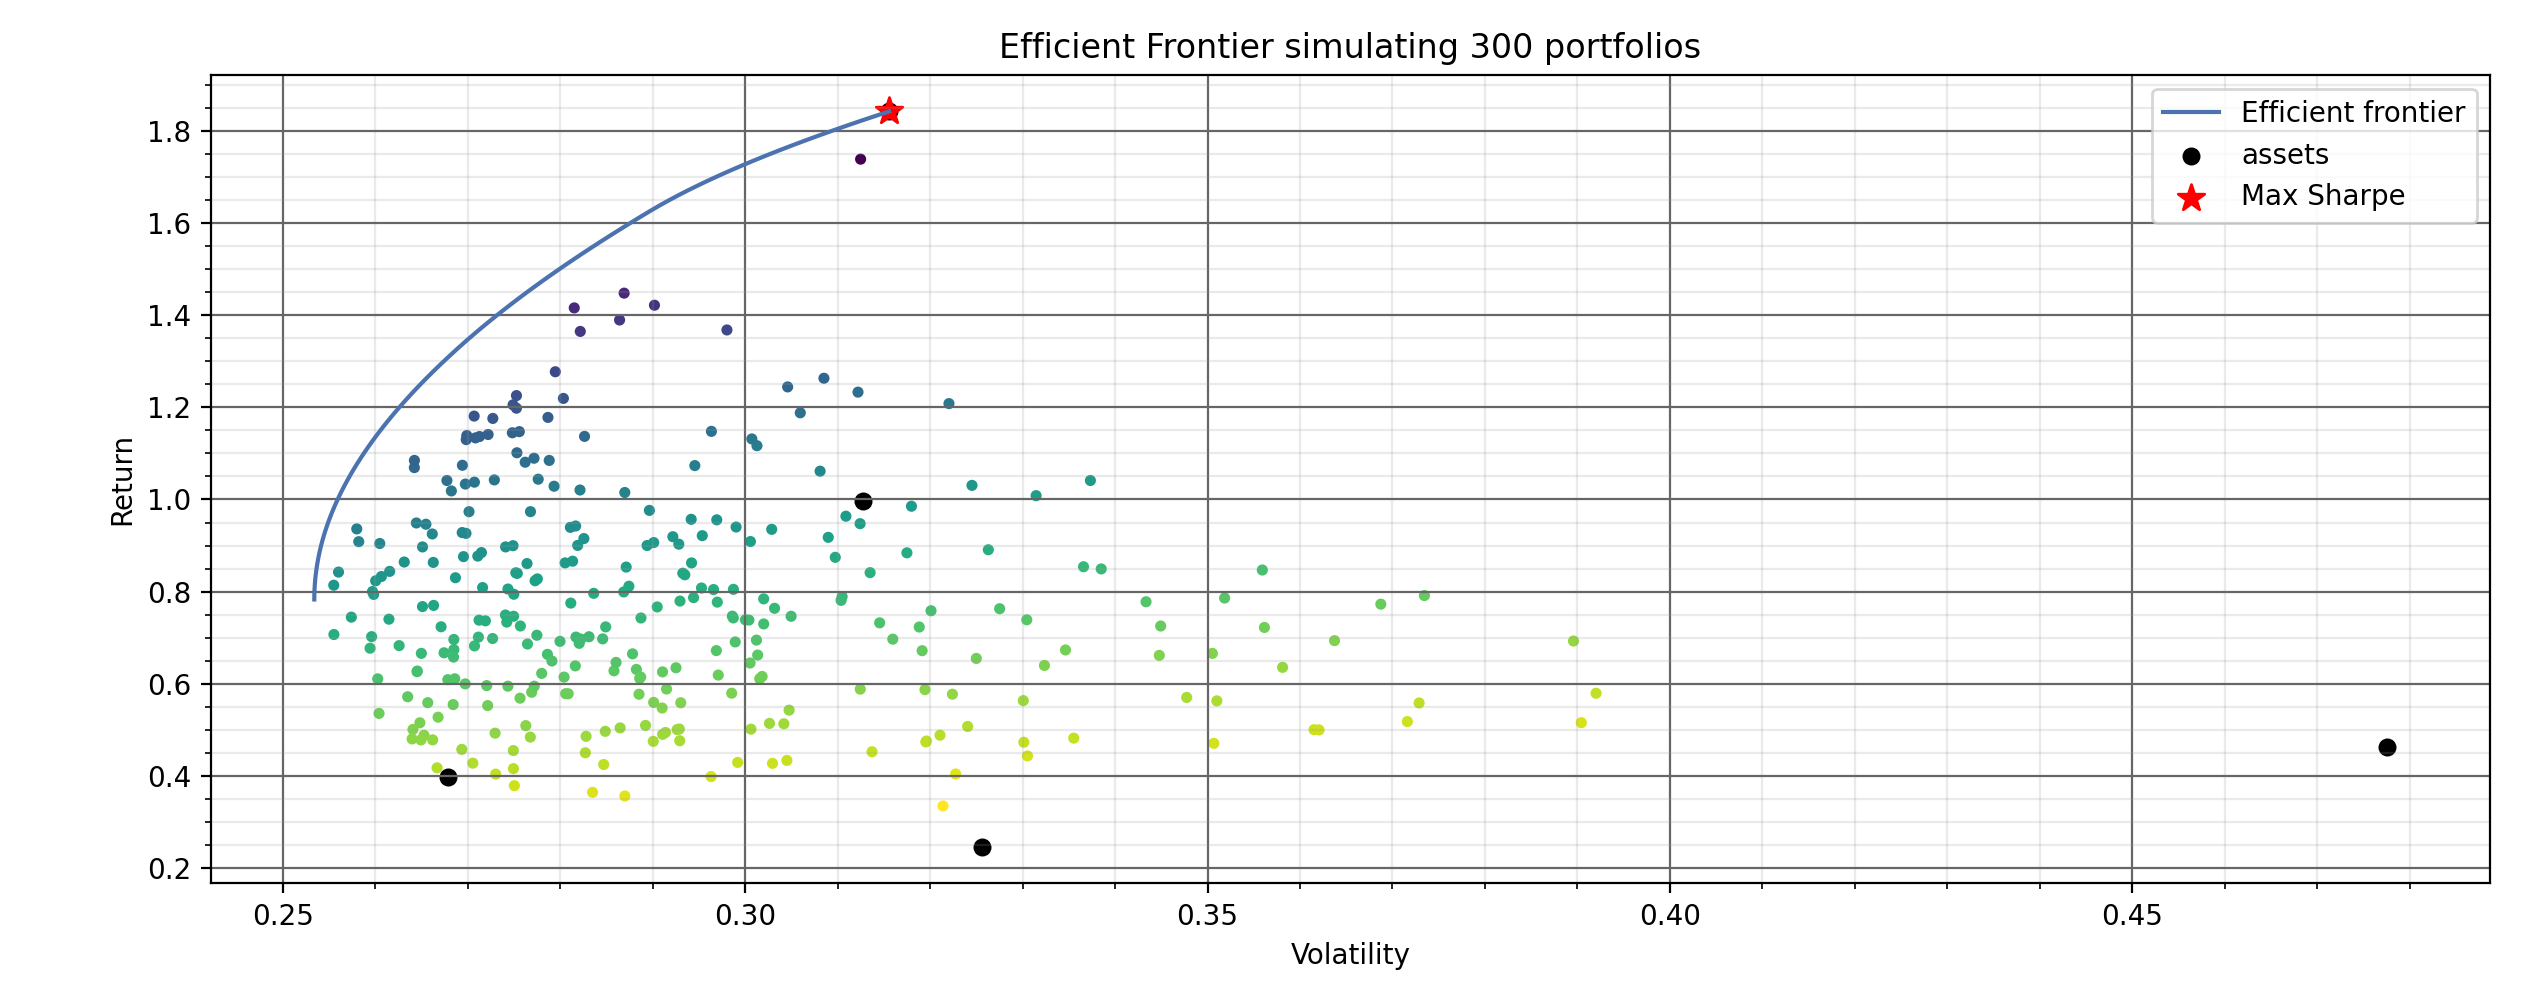
This function plots random portfolios based on their risk and returns and shows the efficient frontier.
- -n : Number of portfolios to simulate. Default 300.
- -p : Amount of time to retrieve data from yfinance. Options are: 1d,5d,1mo,3mo,6mo,1y,2y,5y,10y,ytd,max and it defaults to 3mo.