7f05e2e7ae
* Added init files fixed pylint

* Updated coverage settings

* Fixing pylint issues

* Refactored residual_api imports

* Fixing pylint

* Fixing pylint

* Update fx_view.py

* Fixed black

* Removing ignore

Co-authored-by: Colin Delahunty <colindelahunty@Colins-Air.attlocal.net>
BEHAVIOURAL ANALYSIS
This menu aims to extrapolate behavioural analysis regarding a pre-loaded ticker, and the usage of the following commands along with an example will be exploited below.
- finbrain
- sentiment from 15+ major news headlines
- stats
- sentiment stats including comparison with sector
- wsb
- show what WSB gang is up to in subreddit wallstreetbets
- watchlist
- show other users watchlist
- popular
- show popular tickers
- spac_c
- show other users spacs announcements from subreddit SPACs community
- spac
- show other users spacs announcements from other subs
- bullbear
- estimate quick sentiment from last 30 messages on board
- messages
- output up to the 30 last messages on the board
- trending
- trending stocks
- stalker
- stalk stocktwits user's last messages
- infer
- infer about stock's sentiment from latest tweets
- sentiment
- in-depth sentiment prediction from tweets over time
- mentions
- interest over time based on stock's mentions
- regions
- regions that show highest interest in stock
- queries
- top related queries with this stock
- rise
- top rising related queries with stock
- metrics
- core social sentiment metrics for this stock
- social
- social media figures for stock popularity
- historical
- plot the past week of data for a selected metric
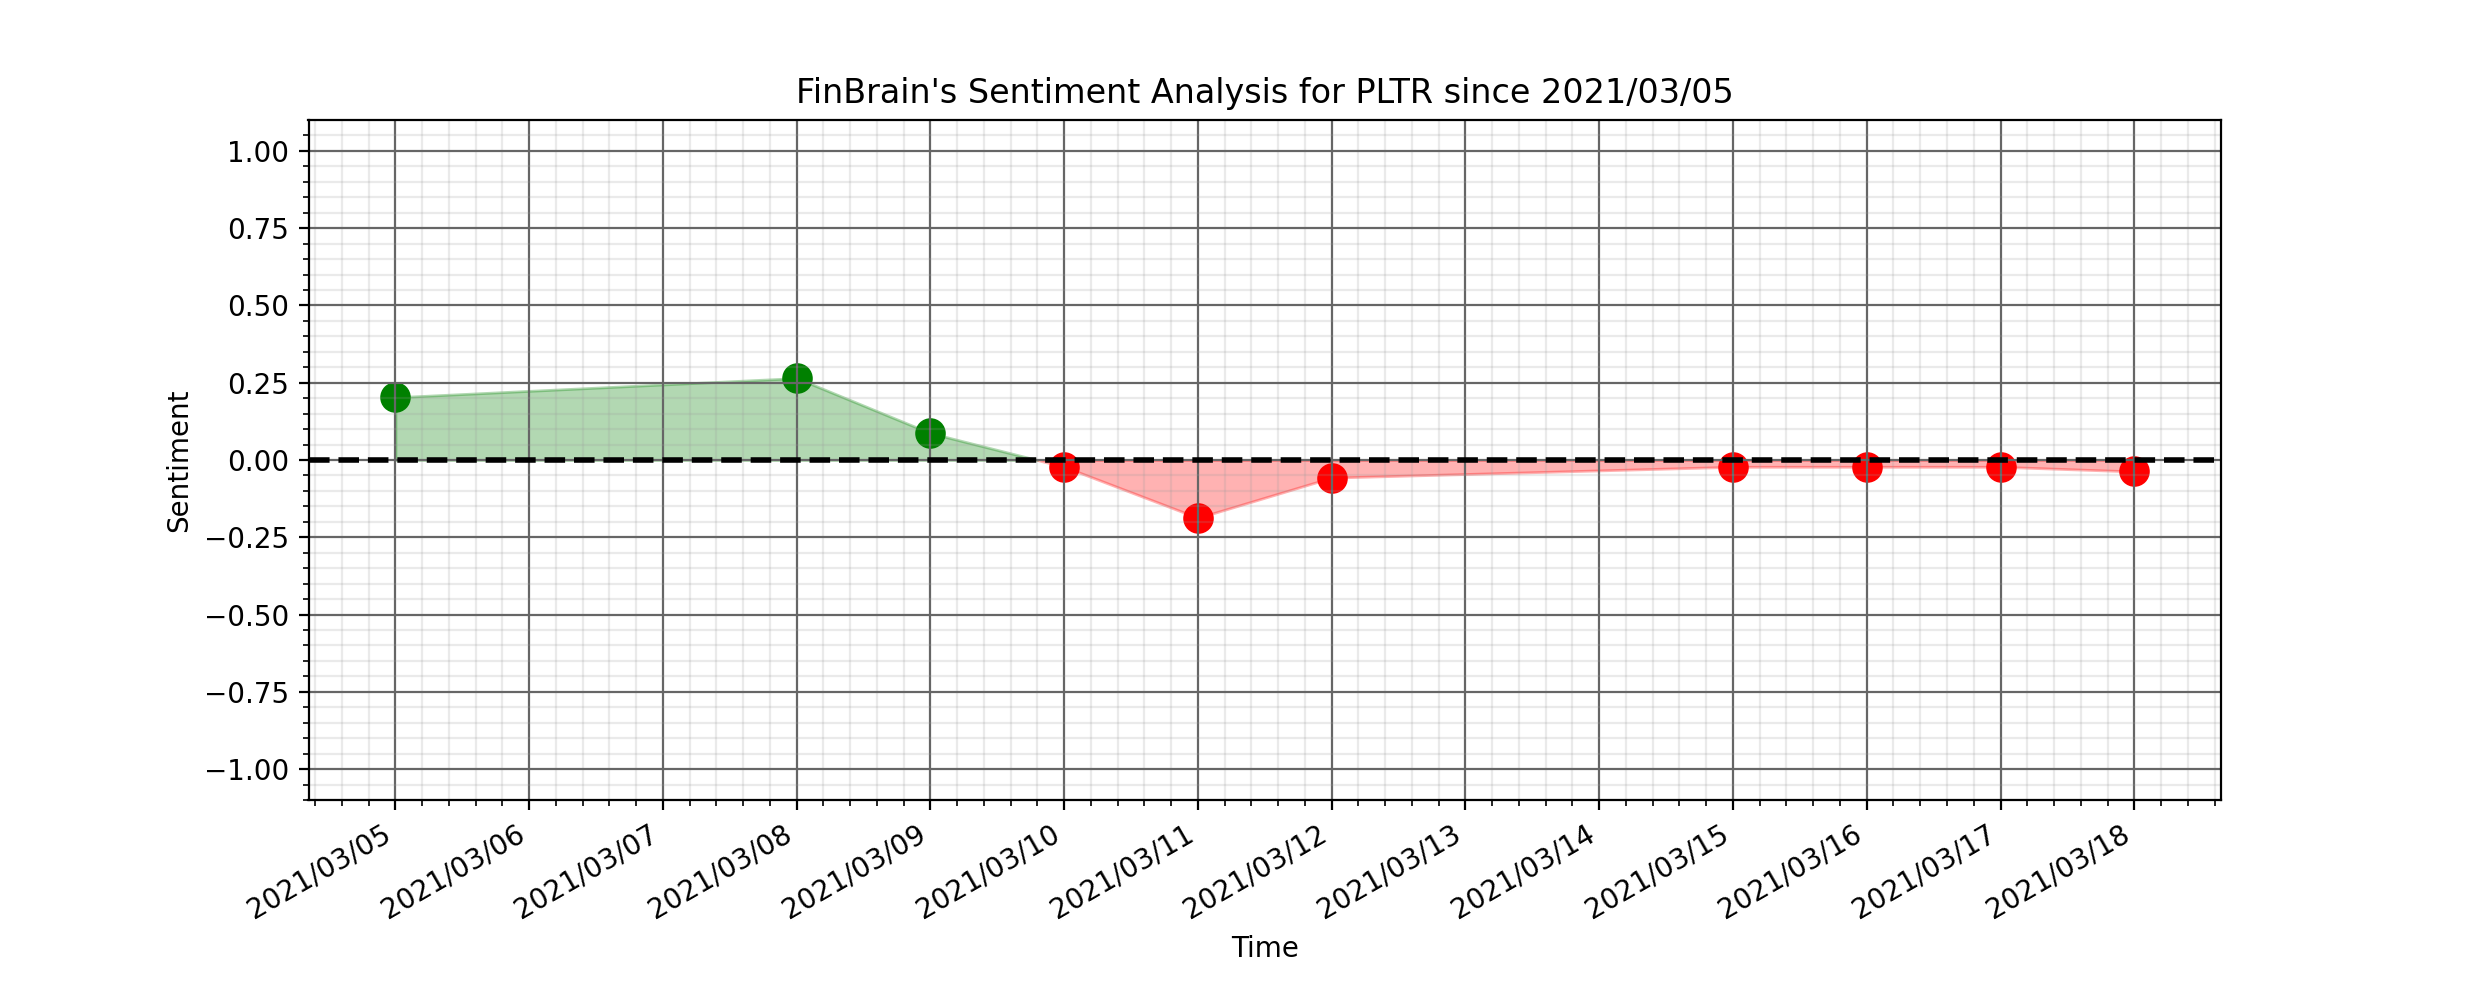
finbrain
usage: finbrain
FinBrain collects the news headlines from 15+ major financial news sources on a daily basis and analyzes them to generate sentiment scores for more than 4500 US stocks. FinBrain Technologies develops deep learning algorithms for financial analysis and prediction, which currently serves traders from more than 150 countries all around the world. [Source: See https://finbrain.tech]

stats
usage: stats
Sentiment stats which displays buzz, news score, articles last week, articles weekly average, bullish vs bearish percentages, sector average bullish percentage, and sector average news score. [Source: https://finnhub.io]

wsb
usage: wsb [-l N_LIMIT] [-n]
Print what WSB gang are up to in subreddit wallstreetbets. [Source: Reddit]
- -l : limit of posts to print. Default 10.
- -n : new flag, if true the posts retrieved are based on being more recent rather than their score. Default False.

watchlist
usage: watchlist [-l N_LIMIT]
Print other users watchlist. [Source: Reddit]
- -l : limit of posts to print. Default 5.

popular
usage: popular [-l N_LIMIT] [-s S_SUBREDDIT] [-d N_DAYS]
Print latest popular tickers. [Source: Reddit]
- -l : limit of posts retrieved per sub reddit. Default 50.
- -s : subreddits to look for tickers, e.g. pennystocks,stocks. Default: pennystocks, RobinHoodPennyStocks, Daytrading, StockMarket, stocks, investing, wallstreetbets.

spac_c
usage: spac_c [-l N_LIMIT] [-p]
Print other users SPACs announcement under subreddit 'SPACs'. [Source: Reddit]
- -l : limit of posts with SPACs retrieved. Default 10.
- -p : popular flag, if true the posts retrieved are based on score rather than time. Default False.

spac
usage: spac [-h] [-l N_LIMIT] [-d N_DAYS]
Print other users SPACs announcement under subreddit 'SPACs'. [Source: Reddit]
- -l : limit of posts with SPACs retrieved. Default 5.

STOCKTWITS
bullbear
usage: bullbear [-t S_TICKER]
Print bullbear sentiment based on last 30 messages on the board. Also prints the watchlist_count. [Source: Stocktwits]
- -t : ticker to gather sentiment from.

messages
usage: messages [-t S_TICKER] [-l N_LIM]
Print up to 30 of the last messages on the board. [Source: Stocktwits]
- -t : get board messages from this ticker. Default pre-loaded.
- -l : limit messages shown. Default 30.

trending
usage: trending
Stocks trending. [Source: Stocktwits]

stalker
usage: stalker [-u S_USER] [-l N_LIM]
Print up to the last 30 messages of a user. [Source: Stocktwits]
- -u : username. Default newsfilter.
- -l : limit messages shown. Default 30.

Uses VADER sentiment. VADER (Valence Aware Dictionary and sEntiment Reasoner) is a lexicon and rule-based sentiment analysis tool that is specifically attuned to sentiments expressed in social media.
The output of VADER analysis :
The compound score is computed by summing the valence scores of each word in the lexicon, adjusted according to the
rules, and then normalized to be between -1 (most extreme negative) and +1 (most extreme positive). This is the most
useful metric if you want a single unidimensional measure of sentiment for a given sentence. Calling it a 'normalized,
 weighted composite score' is accurate.
A sample tweet is shown below along with what the VADER polarity scores are.
Have some $SENS  🚀🏆\n👉FDA approval coming very soon, 👉News is out, amazing test results. \n👉Very high short
interest rate. \n👉Major short squeeze coming. \n\n$amc $gme $nakd $ctrm $tsla $aapl $oeg $aht $bbby $bb $fsr $spce
 https://t.co/B0cPhufpA2'
This gives the following scores:
created_at                                  Thu Jun 03 20:37:54
text          Have some $SENS  🚀🏆\n👉FDA approval coming very...
sentiment                                                 0.872
positive                                                  0.177
negative                                                      0
neutral                                                   0.823
Note that both functions use twitters v2 endpoint, which only gives 7 days of historical data. It also requires at least 10 tweets be pulled.
infer
usage: infer [-n N_NUM]
Print quick sentiment inference from last tweets that contain the ticker. This model splits the text into character-level tokens and uses theVADER model to make predictions.
- -n : num of latest tweets to infer from. Default 100.
sentiment
usage: sentiment [-n N_NUM] [-d N_DAYS_PAST]
Plot in-depth sentiment extracted from tweets from last days that contain pre-defined ticker. This model splits the text into character-level tokens and uses the VADER model to make predictions.
- -n : num of tweets to extract per hour. Default 15.
- -d : num of days in the past to extract tweets. Default 6. Max 6
mentions
usage: mentions [-s S_START]
Plot weekly bars of stock's interest over time. other users watchlist. [Source: Google]
- -s : starting date (format YYYY-MM-DD) from when we are interested in stock's mentions. Default: the one provided in main menu.

regions
usage: regions [-n N_NUM]
Plot bars of regions based on stock's interest. [Source: Google]
- -n : number of regions to plot that show highest interest. Default 10.

queries
usage: queries [-n N_NUM]
Print top related queries with this stock's query. [Source: Google]
- -n : number of top related queries to print. Default 10.

rise
usage: rise [-n N_NUM]
Print top rising related queries with this stock's query. [Source: Google]
- -n : number of top rising related queries to print. Default 10.

SENTIMENTINVESTOR
Sentiment Investor analyzes data from four major social media platforms to generate hourly metrics on over 2,000 stocks. Sentiment provides volume and sentiment metrics powered by proprietary NLP models.
Metric definitions
AHI (Absolute Hype Index)
AHI is a measure of how much people are talking about a stock on social media. It is calculated by dividing the total number of mentions for the chosen stock on a social network by the mean number of mentions any stock receives on that social medium.
RHI (Relative Hype Index)
RHI is a measure of whether people are talking about a stock more or less than usual, calculated by dividing the mean AHI for the past day by the mean AHI for for the past week for that stock.
Sentiment Score
Sentiment score is the percentage of people talking positively about the stock. For each social network the number of positive posts/comments is divided by the total number of both positive and negative posts/comments.
SGP (Standard General Perception)
SGP is a measure of whether people are more or less positive about a stock than usual. It is calculated by averaging the past day of sentiment values and then dividing it by the average of the past week of sentiment values.
metrics
usage: metrics [-h] [ticker]
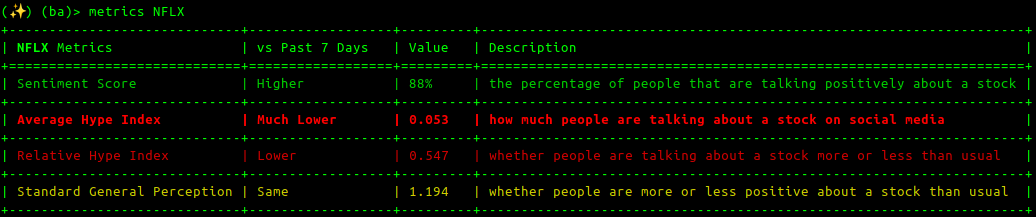
The metrics command presents the four core metrics provided by Sentiment Investor,
including AHI, RHI, sentiment and SGP, as described above.
Optional arguments:
- [optional, positional] ticker ticker to use instead of the loaded one
-h,--helpshow this help message
Example output:
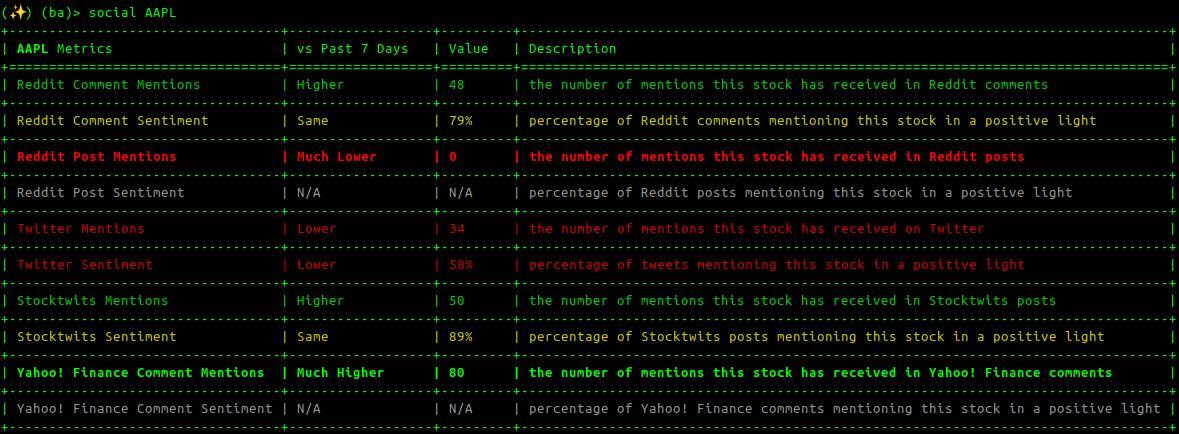
social
usage: social [-h] [ticker]
The social command prints the raw data for a given stock, including the number
of mentions it has received on social media in the last hour and the sentiment
score of those comments.
Optional arguments:
- [optional, positional] ticker ticker to use instead of the loaded one
-h,--helpshow this help message
Example output:
historical
usage: historical [-t TICKER] [-s [{date,value}]] [-d [{asc,desc}]] [-h] [{sentiment,AHI,RHI,SGP}]
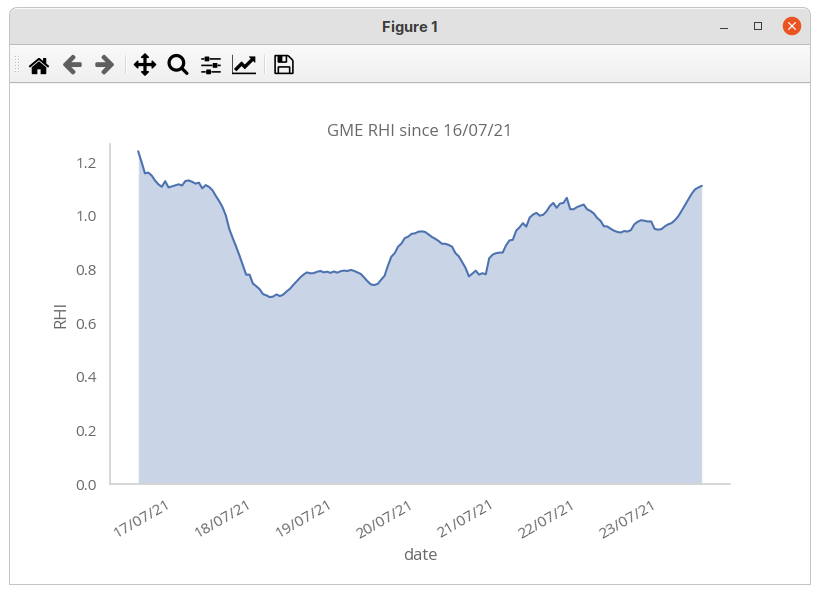
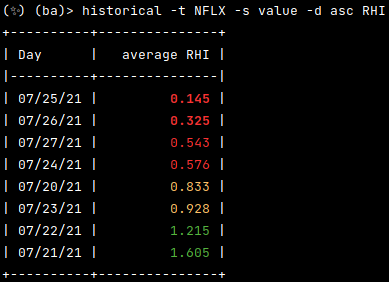
The historical command plots the past week of data for a selected
SentimentInvestor core metric, one of:
AHI, RHI, sentiment or SGP.
It also outputs a sorted table of the mean value for that metric for each day.
Positional arguments:
- one of
sentiment,AHI,RHIorSGP(optional) the metric to plot (default:sentiment)
Optional arguments:
-t,--ticker TICKERticker for which to fetch data-s,--sort [{date,value}]the parameter to sort output table by-d,--direction [{asc,desc}]the direction to sort the output table-h,--helpshow this help message
Example output: