
TECHNICAL ANALYSIS
This menu aims to perform a technical analysis on a pre-loaded ticker chart, and the usage of the following commands along with an example will be exploited below.
- view
- view historical data and trendlines [Finviz]
- summary
- technical summary report [FinBrain API]
- recom
- recommendation based on Technical Indicators [Tradingview API]
- pr
- pattern recognition [Finnhub]
- cci
- commodity channel index
- macd
- moving average convergence/divergence
- rsi
- relative strength index
- stoch
- stochastic oscillator
- bbands
- bollinger bands
S/O to https://github.com/twopirllc/pandas-ta Owing to this library, it is fairly easy to add other technical indicators. So, let us know if there's any other that you would like.
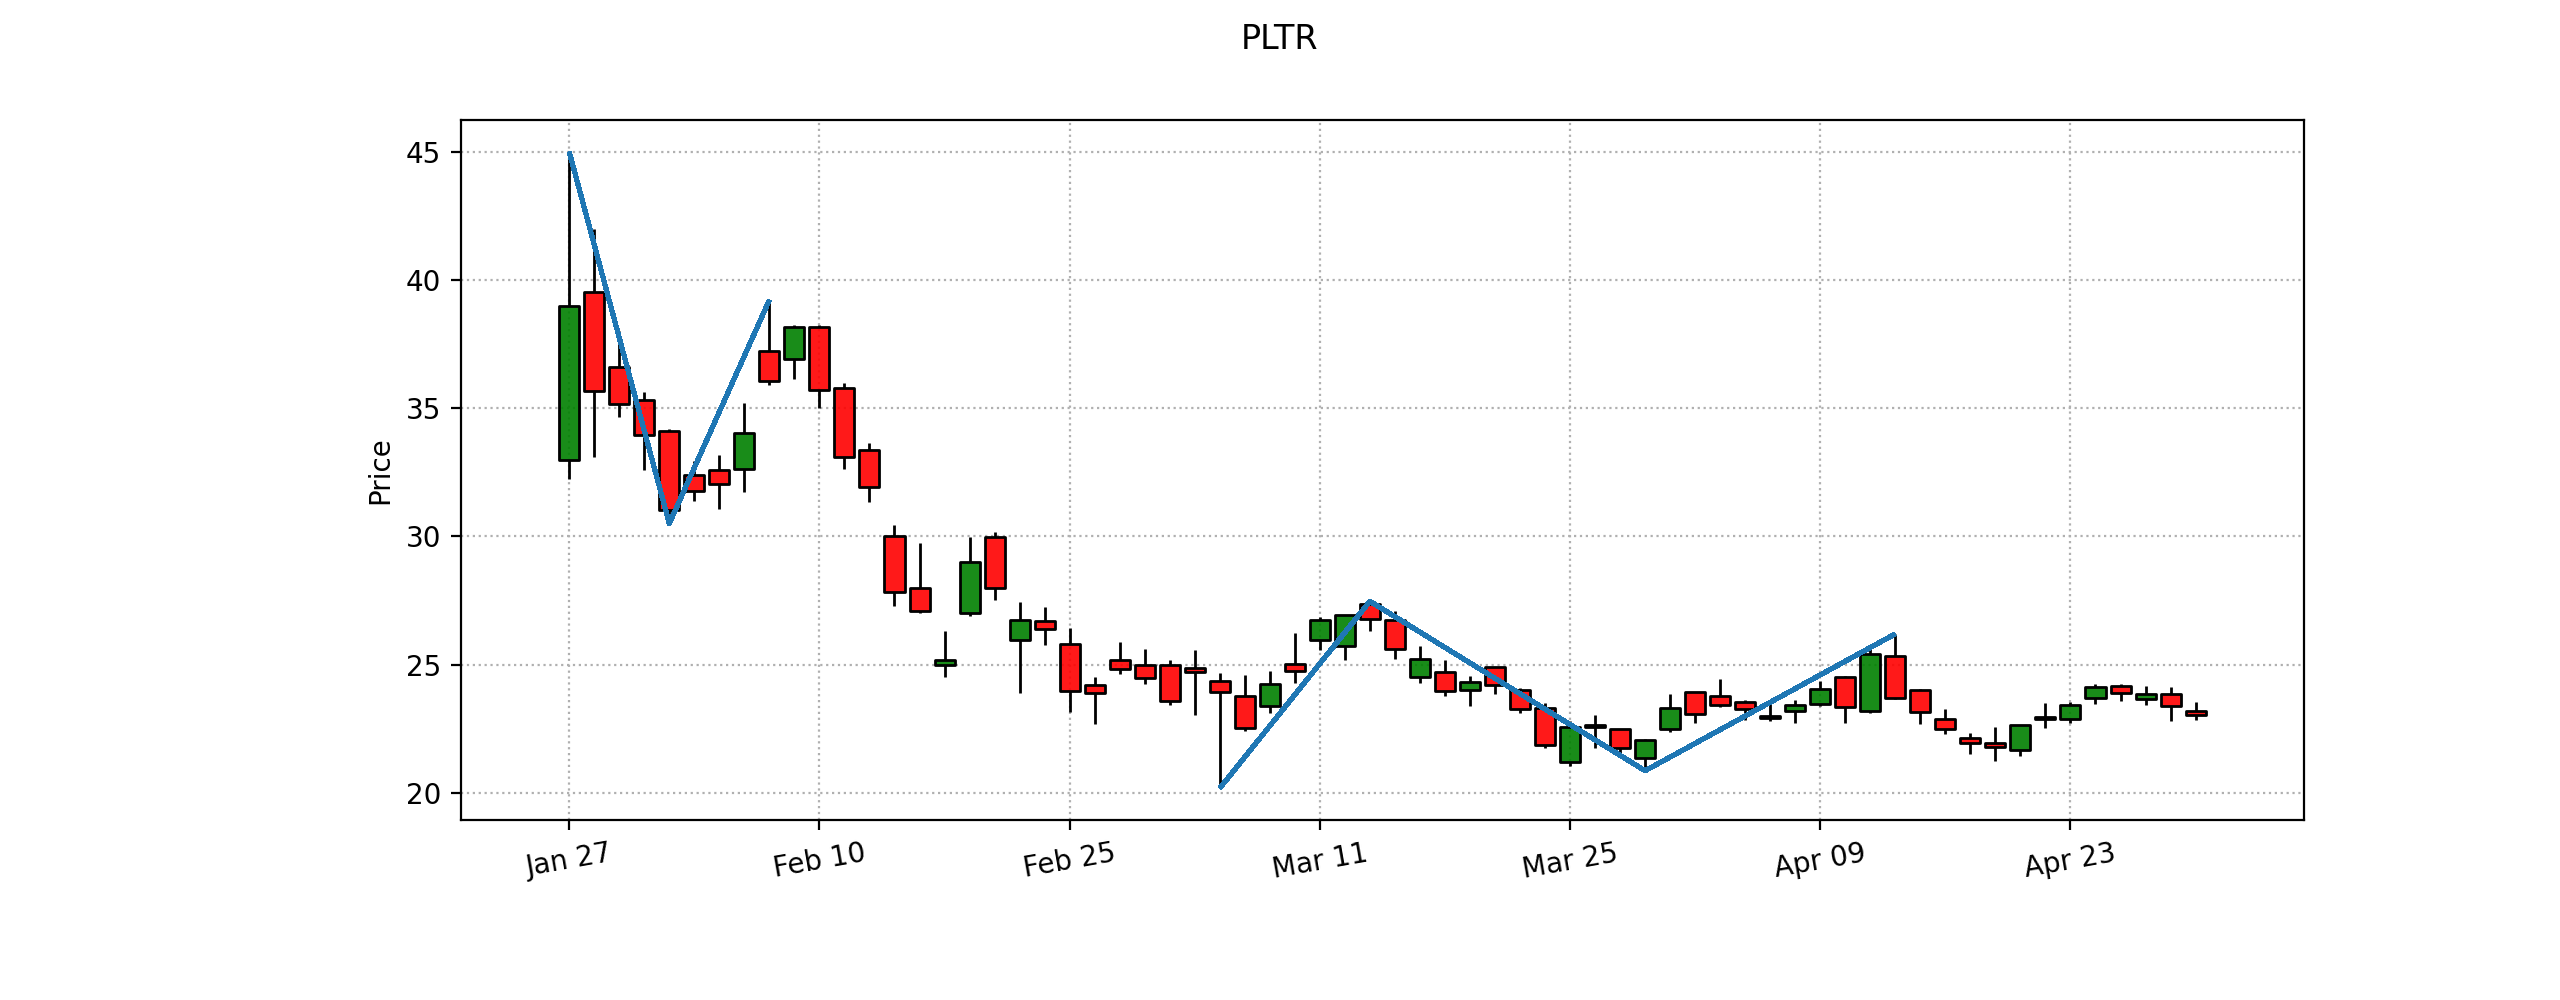
view
usage: view
View historical price with trendlines. [Source: Finviz]

summary
usage: summary
Technical summary report provided by FinBrain's API. FinBrain Technologies develops deep learning algorithms for financial analysis and prediction, which currently serves traders from more than 150 countries all around the world. [Source: https://finbrain.tech]

recom
usage: recom [-s {crypto,forex,cfd}] [-e EXCHANGE] [-i {1M,1W,1d,4h,1h,15m,5m,1m}]
Print tradingview recommendation based on technical indicators. [Source: https://pypi.org/project/tradingview-ta/]
- -s : screener. Default america.
- -e : exchange, e.g. NASDAQ, NYSE. Default uses Alpha Vantage to get this information from ticker
- -i : interval. Default is showing all of different intervals.

pr
usage: pr [-r {1,5,15,30,60,D,W,M}]
Display pattern recognition signals on the data. [Source: https://finnhub.io]
- -r : Plot resolution to look for pattern signals. Default 'D'.

OVERLAP
ema
usage: ema [-l N_LENGTH] [-o N_OFFSET]

sma
usage: sma [-l L_LENGTH] [-o N_OFFSET]

vwap
usage: vwap [-o N_OFFSET]

MOMENTUM
cci
usage: cci [-l N_LENGTH] [-s N_SCALAR] [-o N_OFFSET]

macd
usage: macd [-f N_FAST] [-s N_SLOW] [--signal N_SIGNAL] [-o N_OFFSET]

rsi
usage: rsi [-l N_LENGTH] [-s N_SCALAR] [-d N_DRIFT] [-o N_OFFSET]

stoch
usage: stoch [-k N_FASTKPERIOD] [-d N_SLOWDPERIOD] [--slowkperiod N_SLOWKPERIOD] [-o N_OFFSET]

TREND
adx
usage: adx [-l N_LENGTH] [-s N_SCALAR] [-d N_DRIFT] [-o N_OFFSET]

aroon
usage: aroon [-l N_LENGTH] [-s N_SCALAR] [-o N_OFFSET]

VOLATILITY
bbands
usage: bbands [-h] [-l N_LENGTH] [-s N_STD] [-m S_MAMODE] [-o N_OFFSET]

VOLUME
ad
usage: ad [-o N_OFFSET] [--open]

obv
usage: obv [-o N_OFFSET]
