cead88555c
* Adds guide for QA module of the SDK

* makes requested changes

Co-authored-by: Jeroen Bouma <jer.bouma@gmail.com>
3.7 KiB
Vendored
title, keywords, excerpt, geekdocCollapseSection
| title | keywords | excerpt | geekdocCollapseSection |
|---|---|---|---|
| Introduction to Quantitative Analysis | qa, quant, quantitative, bw, var, es, kurtosis, normality, omega, quantile, rolling, sharpe, skew, spread, summary, unitroot, var, math | This guide introduces the Quantitative Analysis module, and provides some examples. | true |
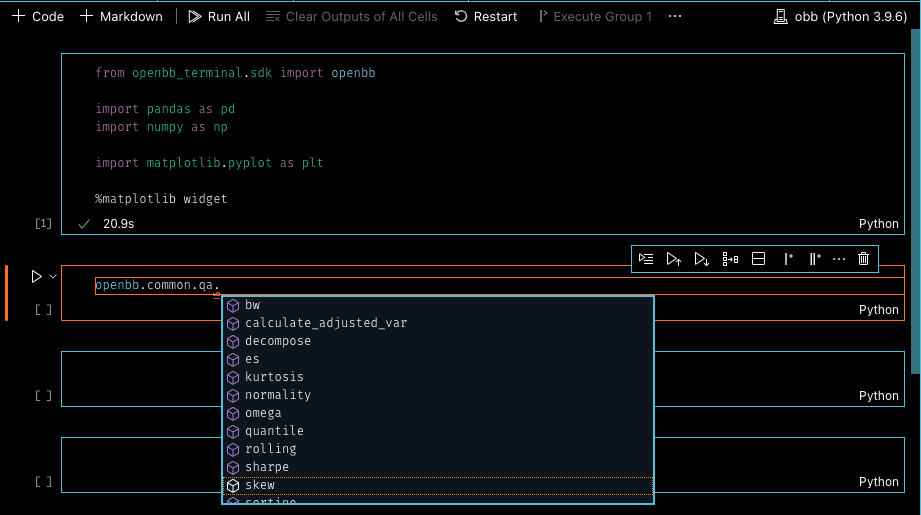
The qa module replicates the features of the Quantitative Analysis menu, within the OpenBB Terminal, for the SDK environment. It provides users with more ways to interact with the library of functions, and provides cross-disciplinary utility. To activate the code completion for the menu, enter . after, openbb.common.qa.
How to Use
With the modules imported, the next step would be to collect data for analysis. In this example, the Quandl API will be used. To pass the key to the URL string, import:
import openbb_terminal.config_terminal as cfg
The credentials can then be passed with:
f"{cfg.API_KEY_QUANDL}"
As a functional code block, this looks like:
from openbb_terminal.sdk import openbb
import openbb_terminal.config_terminal as cfg
import pandas as pd
import matplotlib.pyplot as plt

%matplotlib widget
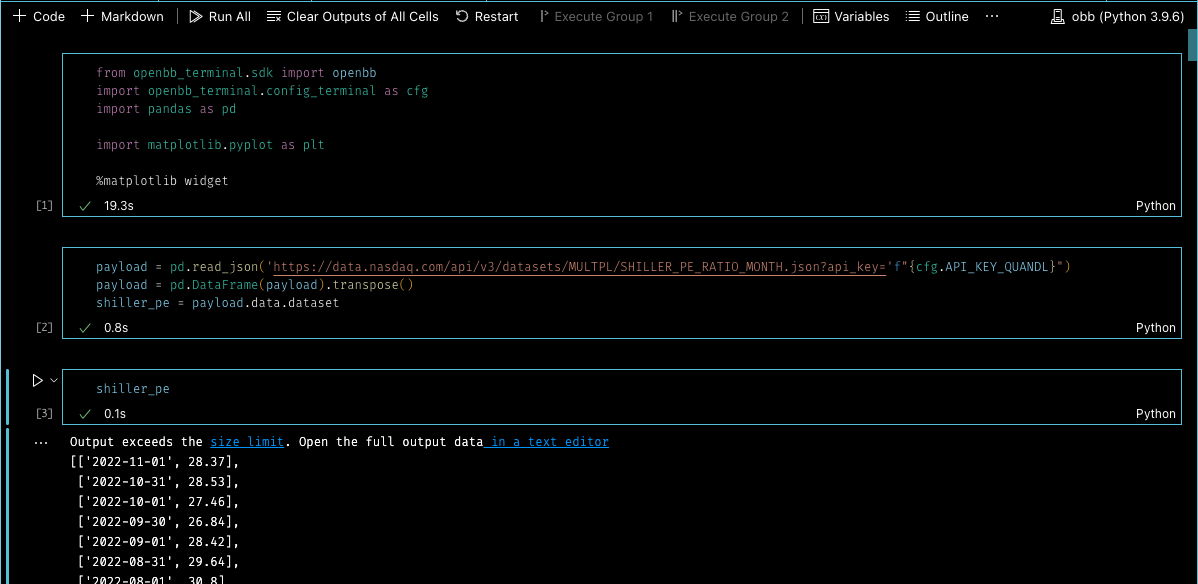
payload = pd.read_json('https://data.nasdaq.com/api/v3/datasets/MULTPL/SHILLER_PE_RATIO_MONTH.json?api_key='f"{cfg.API_KEY_QUANDL}")
payload = pd.DataFrame(payload).transpose()
shiller_pe = payload.data.dataset
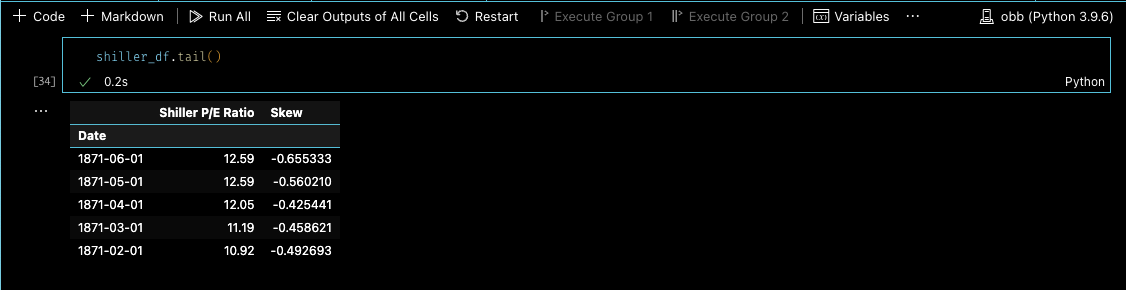
Now, with the data loaded, the next block will utilize the skew function, to target the monthly Shiller P/E Ratio of the S&P 500 from inception.
shiller_df = pd.DataFrame(columns = ['Date', 'Shiller P/E Ratio', 'Skew'])
shiller_pe = pd.DataFrame(shiller_pe)
shiller_skew = openbb.common.qa.skew(data = shiller_pe[1], window = 3)

shiller_df['Date'] = shiller_pe[0].values
shiller_df['Shiller P/E Ratio'] = shiller_pe[1].values
shiller_df['Skew'] = shiller_skew
shiller_df.set_index(keys = ['Date'], inplace = True)

shiller_df.tail()
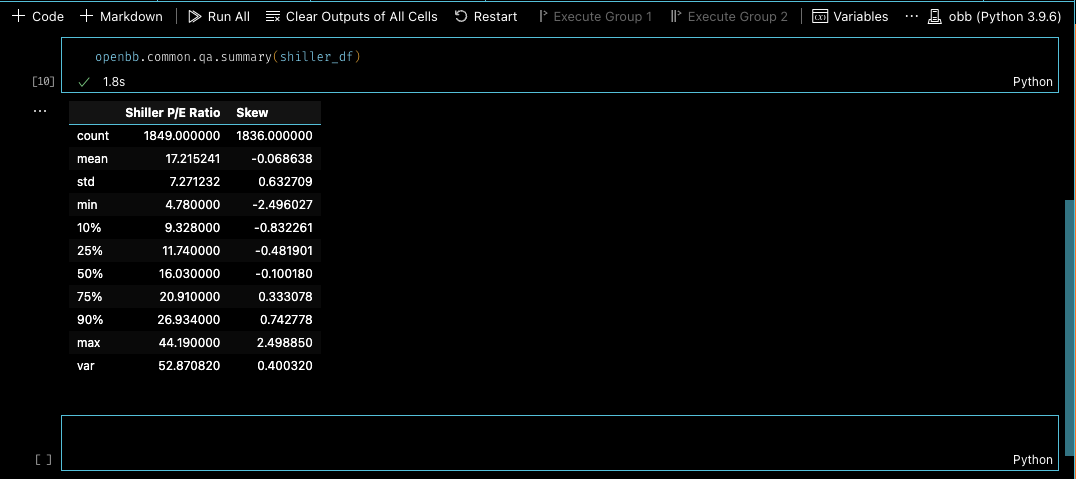
Get a summary of the DataFrame:
openbb.common.qa.summary(shiller_df)
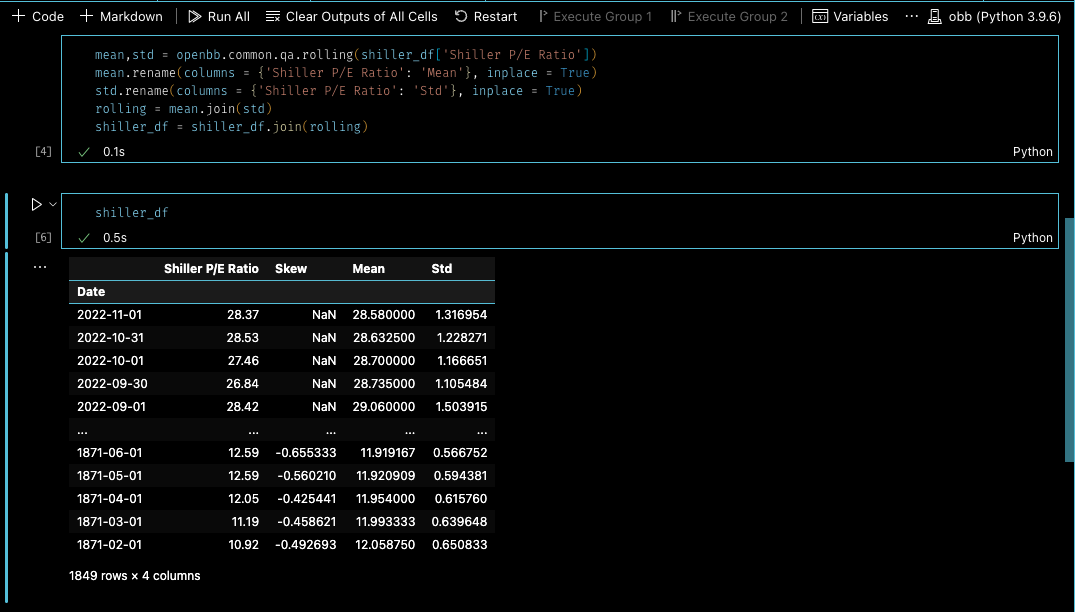
Insert the rolling mean and standard deviation of a target column with, openbb.common.qa.rolling:
mean,std = openbb.common.qa.rolling(shiller_df['Shiller P/E Ratio'])
mean.rename(columns = {'Shiller P/E Ratio': 'Mean'}, inplace = True)
std.rename(columns = {'Shiller P/E Ratio': 'Std'}, inplace = True)
rolling = mean.join(std)
shiller_df = shiller_df.join(rolling)

shiller_df
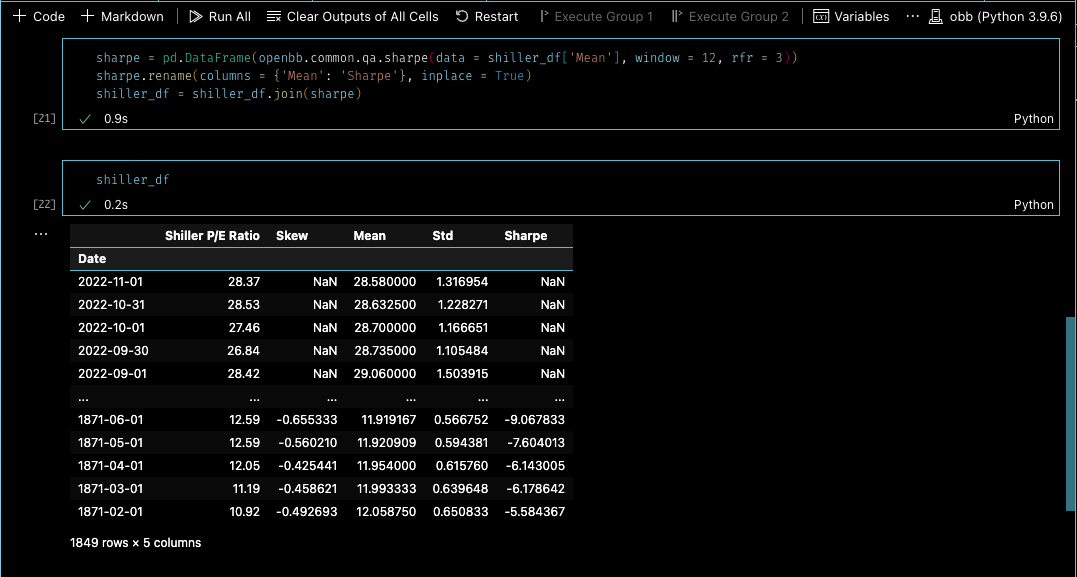
Calculate and join the Sharpe Ratio of, for example, the rolling mean average of the Shiller P/E ratio:
sharpe = pd.DataFrame(openbb.common.qa.sharpe(data = shiller_df['Mean'], window = 12, rfr = 3))
sharpe.rename(columns = {'Mean': 'Sharpe'}, inplace = True)
shiller_df = shiller_df.join(sharpe)