 6381b2ae7d
* fixing a url

* moving around menus

* Grammar Update

* many fixes to links and some added pics to install

* Add improvements

* fix: tabs

* Move support/feedback window to FAQ

* Forgot to save

* MVC moved around

* change installation Source -> Python

* fix: tabs

* guides to basics

* Add new README LINKS

* Change links

* Change forecasting to forecast

* fix: details

* more fixes

* Change markdown file so it is ready for pypi

Co-authored-by: Chavithra <chavithra@gmail.com>
Co-authored-by: Danglewood <85772166+deeleeramone@users.noreply.github.com>
Co-authored-by: Jeroen Bouma <jer.bouma@gmail.com>
Co-authored-by: Jeroen Bouma <jeroenbouma@Jeroens-MacBook-Pro.local>
Co-authored-by: jose-donato <zmcdonato@gmail.com>
23 KiB
Vendored
title, keywords, excerpt
| title | keywords | excerpt | ||||||
|---|---|---|---|---|---|---|---|---|
| ETF |
|
The Introduction to ETFs explains how to use the menu and provides a brief description of its sub-menus |
The ETF menu enables you to lookup any ETFand obtain an overview, holdings, weights and news about the chosen ETF. Furthermore, sub-menus reside in this menu that can be used to compare companies within the ETF, discover gainers and losers within discovery and apply advanced technical indicators and Forecasting menu. Lastly, it also has the option to export multiple ETFs to Excel with pir.
How to use
The ETF menu is called upon by typing etf which opens the following menu:

You now have the ability to look up any ETF. With the example below, the load command is used to load an ETF.
2022 Jun 21, 09:22 (🦋) /etf/ $ load VOO
Top company holdings found: AAPL, MSFT, AMZN, GOOGL, TSLA
Now we can use holdings to see the makeup of VOO
2022 Jun 21, 09:14 (🦋) /etf/ holdings

                                                          ETF Holdings
┌───────┬─────────────────────────────────┬──────────┬───────────┐
│       │ Name                            │ % Of Etf │ Shares    │
├───────┼─────────────────────────────────┼──────────┼───────────┤
│ AAPL  │ Apple Inc.                      │ 7.08%    │ 345662285 │
├───────┼─────────────────────────────────┼──────────┼───────────┤
│ MSFT  │ Microsoft Corporation           │ 5.29%    │ 170648491 │
├───────┼─────────────────────────────────┼──────────┼───────────┤
│ AMZN  │ Amazon.com, Inc.                │ 2.77%    │ 202804167 │
├───────┼─────────────────────────────────┼──────────┼───────────┤
│ TSLA  │ Tesla, Inc.                     │ 1.85%    │ 60944555  │
├───────┼─────────────────────────────────┼──────────┼───────────┤
│ GOOGL │ Alphabet, Inc.                  │ 1.73%    │ 137178918 │
├───────┼─────────────────────────────────┼──────────┼───────────┤
│ BRK.B │ Berkshire Hathaway Inc.         │ 1.63%    │ 41297378  │
├───────┼─────────────────────────────────┼──────────┼───────────┤
│ UNH   │ UnitedHealth Group Incorporated │ 1.59%    │ 21403214  │
├───────┼─────────────────────────────────┼──────────┼───────────┤
│ GOOG  │ Alphabet, Inc.                  │ 1.55%    │ 122705978 │
├───────┼─────────────────────────────────┼──────────┼───────────┤
│ XOM   │ Exxon Mobil Corporation         │ 1.41%    │ 95363206  │
├───────┼─────────────────────────────────┼──────────┼───────────┤
│ JNJ   │ Johnson & Johnson               │ 1.40%    │ 60159633  │
└───────┴─────────────────────────────────┴──────────┴───────────┘
To then view the stock chart, you can call candle which shows a candle chart for the defined period (by default set to a year by load):

By calling ? or help the ETF menu re-appears. Here you can see that multiple commands menus have turned blue. Because of loading a ticker, these menus can now be used in combination with the chosen ticker.

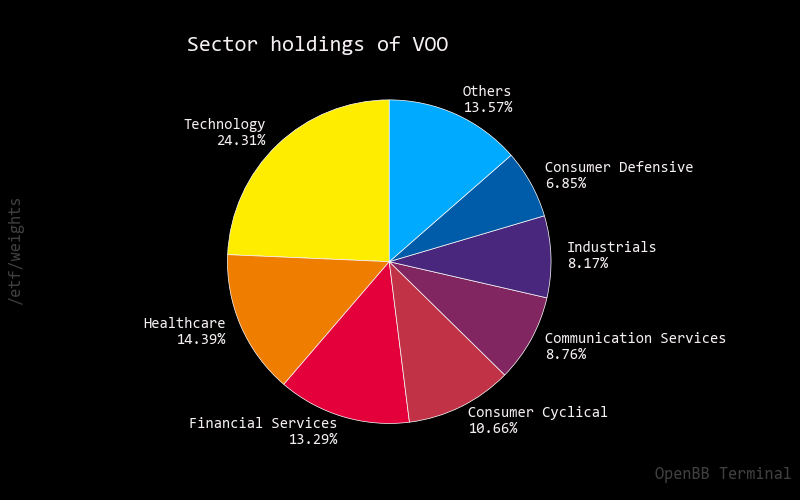
For example, the ETF's weights can now be depicted with the following:
2022 Jun 21, 09:45 (🦋) /etf/ $ weights
Which shows the following graph:
Sub-menus available
The ETF menu has a few sub-menus available to delve further into a specific ETF or screen multiple ETFs at the same time. To find more information about each menu, click on one of the following:
- Introduction to Comparison Analysis: have the ability to compare companies within the ETF based on, among other things, correlation, financial statements, sentiment, valuations and performance.
- Introduction to Technical Analysis: analysis the chosen ETF's historical data extensively with moving averages and momentum, trend, volatility and volume indicators.
- Introduction to Forecasting menu: apply advanced AI and Machine Learning models to form prediction of future ETF prices including Recurrent Neural Network (RNN), Autoregressive Integrated Moving Average (ARIMA) and Monte Carlo forecasting.
Examples
If we want to learn more about a total market ETF, we can do the following, starting from the etf menu and using the ld command where we specify with -l we wish to see 15 ETFs max.
2022 Jun 21, 10:08 (🦋) /etf/ $ ld total market -l 15

                                                              ETFs by Total Assets
┏━━━━━━┳━━━━━━━━━━━━━━━━━━━━━━━━━━━━━━━━━━━━━━━━━━━━━━━━━━━━┳━━━━━━━━━━━━━━━━━━━━━━━━━━━━━━━━━━━┳━━━━━━━━━━━━━━━━━━━━━━━━━━━┳━━━━━━━━━━━━━━━━━━┓
┃      ┃ Name                                               ┃ Family                            ┃ Category                  ┃ Total Assets [M] ┃
┡━━━━━━╇━━━━━━━━━━━━━━━━━━━━━━━━━━━━━━━━━━━━━━━━━━━━━━━━━━━━╇━━━━━━━━━━━━━━━━━━━━━━━━━━━━━━━━━━━╇━━━━━━━━━━━━━━━━━━━━━━━━━━━╇━━━━━━━━━━━━━━━━━━┩
│ VTI  │ Vanguard Total Stock Market Index Fund ETF Shares  │ Vanguard                          │ Large Blend               │ 1169855.61       │
├──────┼────────────────────────────────────────────────────┼───────────────────────────────────┼───────────────────────────┼──────────────────┤
│ ITOT │ iShares Core S&P Total U.S. Stock Market ETF       │ iShares                           │ Large Blend               │ 38539.13         │
├──────┼────────────────────────────────────────────────────┼───────────────────────────────────┼───────────────────────────┼──────────────────┤
│ XBI  │ SPDR S&P Biotech ETF                               │ SPDR State Street Global Advisors │ Health                    │ 7845.92          │
├──────┼────────────────────────────────────────────────────┼───────────────────────────────────┼───────────────────────────┼──────────────────┤
│ HYLB │ Xtrackers USD High Yield Corporate Bond ETF        │ Xtrackers                         │ High Yield Bond           │ 6760.46          │
├──────┼────────────────────────────────────────────────────┼───────────────────────────────────┼───────────────────────────┼──────────────────┤
│ KRE  │ SPDR S&P Regional Banking ETF                      │ SPDR State Street Global Advisors │ Financial                 │ 5101.42          │
├──────┼────────────────────────────────────────────────────┼───────────────────────────────────┼───────────────────────────┼──────────────────┤
│ XOP  │ SPDR S&P Oil & Gas Exploration & Production ETF    │ SPDR State Street Global Advisors │ Equity Energy             │ 3828.98          │
├──────┼────────────────────────────────────────────────────┼───────────────────────────────────┼───────────────────────────┼──────────────────┤
│ XHB  │ SPDR S&P Homebuilders ETF                          │ SPDR State Street Global Advisors │ Consumer Cyclical         │ 2095.61          │
├──────┼────────────────────────────────────────────────────┼───────────────────────────────────┼───────────────────────────┼──────────────────┤
│ XME  │ SPDR S&P Metals and Mining ETF                     │ SPDR State Street Global Advisors │ Natural Resources         │ 1876.30          │
├──────┼────────────────────────────────────────────────────┼───────────────────────────────────┼───────────────────────────┼──────────────────┤
│ SCHK │ Schwab 1000 ETF                                    │ Schwab ETFs                       │ Large Blend               │ 1782.93          │
├──────┼────────────────────────────────────────────────────┼───────────────────────────────────┼───────────────────────────┼──────────────────┤
│ XAR  │ SPDR S&P Aerospace & Defense ETF                   │ SPDR State Street Global Advisors │ Industrials               │ 1364.05          │
├──────┼────────────────────────────────────────────────────┼───────────────────────────────────┼───────────────────────────┼──────────────────┤
│ FPXI │ First Trust International Equity Opportunities ETF │ First Trust                       │ Foreign Large Growth      │ 1124.12          │
├──────┼────────────────────────────────────────────────────┼───────────────────────────────────┼───────────────────────────┼──────────────────┤
│ XSD  │ SPDR S&P Semiconductor ETF                         │ SPDR State Street Global Advisors │ Technology                │ 976.82           │
├──────┼────────────────────────────────────────────────────┼───────────────────────────────────┼───────────────────────────┼──────────────────┤
│ XHE  │ SPDR S&P Health Care Equipment ETF                 │ SPDR State Street Global Advisors │ Health                    │ 802.28           │
├──────┼────────────────────────────────────────────────────┼───────────────────────────────────┼───────────────────────────┼──────────────────┤
│ XRT  │ SPDR S&P Retail ETF                                │ SPDR State Street Global Advisors │ Consumer Cyclical         │ 781.05           │
├──────┼────────────────────────────────────────────────────┼───────────────────────────────────┼───────────────────────────┼──────────────────┤
│ UWM  │ ProShares Ultra Russell2000                        │ ProShares                         │ Trading--Leveraged Equity │ 746.08           │
└──────┴────────────────────────────────────────────────────┴───────────────────────────────────┴───────────────────────────┴──────────────────┘
It seems Vanguard Total Stock Market Index Fund ETF Shares (VTI) is by far the largest ETF in this list so let's load it in. Also, a larger period is chosen by using -s as shown in the documentation:
2022 Jun 21, 10:08 (🦋) /etf/ $ load VTI -s 2010-01-01
Top company holdings found: AAPL, MSFT, AMZN, GOOGL, TSLA
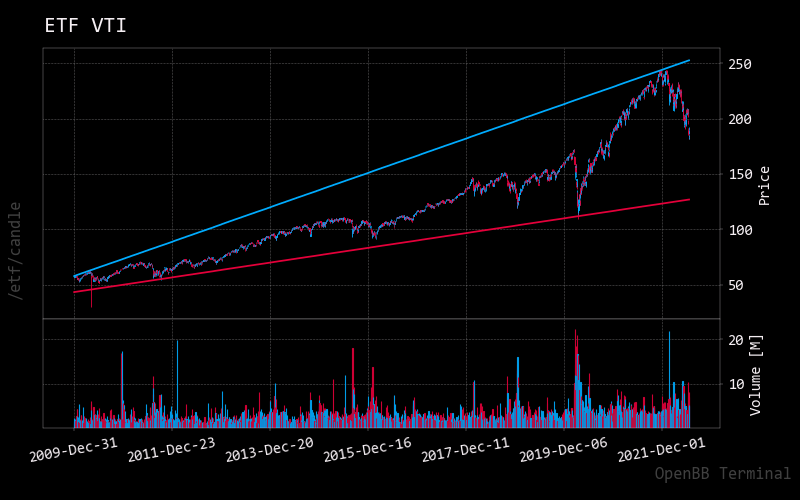
We can now plot the corresponding ETF chart with candle which shows the company's historical data from 2010-01-01 until the current date. We are also adding in trendlines with -t.
2022 Jun 21, 10:13 (🦋) /etf/ $ candle -t
Now we can go ahead and explore more about the ETF by running holdings
and weights using the --raw argument for weights to display a table instead of a graph.
2022 Jun 21, 10:16 (🦋) /etf/ $ holdings

           ETF Holdings
┏━━━━━━━┳━━━━━━━━━━┳━━━━━━━━━━━━━┓
┃       ┃ % Of Etf ┃ Shares      ┃
┡━━━━━━━╇━━━━━━━━━━╇━━━━━━━━━━━━━┩
│ AAPL  │ 5.58%    │ 454,234,952 │
├───────┼──────────┼─────────────┤
│ MSFT  │ 4.93%    │ 219,650,708 │
├───────┼──────────┼─────────────┤
│ AMZN  │ 2.51%    │ 12,672,230  │
├───────┼──────────┼─────────────┤
│ GOOGL │ 1.67%    │ 8,869,298   │
├───────┼──────────┼─────────────┤
│ TSLA  │ 1.52%    │ 24,224,503  │
├───────┼──────────┼─────────────┤
│ GOOG  │ 1.47%    │ 7,802,130   │
├───────┼──────────┼─────────────┤
│ BRK.B │ 1.30%    │ 49,671,912  │
├───────┼──────────┼─────────────┤
│ JNJ   │ 1.14%    │ 77,035,899  │
├───────┼──────────┼─────────────┤
│ UNH   │ 1.13%    │ 27,566,141  │
├───────┼──────────┼─────────────┤
│ META  │ 1.08%    │ 67,655,143  │
└───────┴──────────┴─────────────┘

2022 Jun 21, 10:16 (🦋) /etf/ $ weights --raw

Sector holdings of VTI

              Sector Weightings Allocation
┏━━━━━━━━━━━━━━━━━━━━━━━━┳━━━━━━━━━━━━━━━━━━━━━━━━━━━━━┓
┃                        ┃ % of holdings in the sector ┃
┡━━━━━━━━━━━━━━━━━━━━━━━━╇━━━━━━━━━━━━━━━━━━━━━━━━━━━━━┩
│ Technology             │ 23.55                       │
├────────────────────────┼─────────────────────────────┤
│ Healthcare             │ 13.97                       │
├────────────────────────┼─────────────────────────────┤
│ Financial Services     │ 13.42                       │
├────────────────────────┼─────────────────────────────┤
│ Consumer Cyclical      │ 10.61                       │
├────────────────────────┼─────────────────────────────┤
│ Industrials            │ 9.00                        │
├────────────────────────┼─────────────────────────────┤
│ Communication Services │ 7.98                        │
├────────────────────────┼─────────────────────────────┤
│ Consumer Defensive     │ 6.35                        │
├────────────────────────┼─────────────────────────────┤
│ Energy                 │ 4.81                        │
├────────────────────────┼─────────────────────────────┤
│ Real Estate            │ 3.78                        │
├────────────────────────┼─────────────────────────────┤
│ Basic Materials        │ 2.69                        │
├────────────────────────┼─────────────────────────────┤
│ Utilities              │ 2.29                        │
└────────────────────────┴─────────────────────────────┘