 4ad995fdd0
* add first iteration of content for Terminal Pro

* Update index.md

* Update dashboards.md

* Update folders.md

* Update grouping.md

* Update report.md

* Update templates.md

* Update quick-start.md

* Update index.md

* Update index.md

* Update home.md

* Update news.md

* Update index.md

* Update index.md

* Update index.md

* Update data-provider.md

* Update chat-with-widget.md

* Update data-manipulation.md

* Update forecasting.md

* fix: images self closing tags

* fix: only pro visitors can see pro

* inter font

* improve SEO content and restructuring

* add new package for toggle on tutorials

* move folder around

* improve main page of each prod

* small updates and improvements

* fix logo above

* small improvement in headtitle for portfolio funcs

* fix typos from OpenAI's GPT-4

* fix _category_ json

* remove generic SEO words

* add script that generates SEO for documentation

* add missing file

* remove sdk warning message

* fix links for andrew

---------

Co-authored-by: jose-donato <zmcdonato@gmail.com>
Co-authored-by: jose-donato <43375532+jose-donato@users.noreply.github.com>
Co-authored-by: andrewkenreich <andrew.kenreich@gmail.com>
8.5 KiB
Vendored
title, description, keywords
| title | description | keywords | ||||||||||||||||||||
|---|---|---|---|---|---|---|---|---|---|---|---|---|---|---|---|---|---|---|---|---|---|---|
| Technical Analysis | This documentation page provides a comprehensive guide on using the Technical Analysis Module in Openbb, which is used for analyzing time-series data. It provides detailed usage of functions within the ta module, demonstrating features such as Momentum, Overlap, Trend, Volatility and Volume analysis plus many more techniques. It also showcases how to display the chart, instead of raw data, and best practices on using the module. |
|
import HeadTitle from '@site/src/components/General/HeadTitle.tsx';
The Technical Analysis module is a toolkit for analyzing time-series data, at any resolution. The functions are a collection of formulas that fit into broad categories, and they are mostly derived from the pandas_ta library:
- Momentum
- Overlap (Moving Averages)
- Trend
- Volatility
- Volume
- Other (Fibonacci)
How to Use
Every SDK function also has a secondary _chart command. The table below is a brief description of each SDK function within the ta module; for simplicity, _chart has been omitted. Technical Analysis functions specific to stocks are included as a sub-module, openbb.stocks.ta.
| Path | Category | Description |
|---|---|---|
| openbb.ta.ad | Volume | Accumulation/Distribution Line |
| openbb.ta.adosc | Volume | Chaikin Oscillator |
| openbb.ta.adx | Trend | Average Directional Movement Index |
| openbb.ta.aroon | Trend | Aroon Indicator |
| openbb.ta.atr | Volatility | Average True Range |
| openbb.ta.bbands | Voaltility | Bollinger Bands |
| openbb.ta.cci | Momentum | Commodity Channel Index |
| openbb.ta.cg | Momentum | Center of Gravity |
| openbb.ta.clenow | Momentum | Clenow Volatility Adjusted Momentum |
| openbb.ta.demark | Momentum | Tom Demark's Sequential Indicator (Unofficial) |
| openbb.ta.donchian | Volatility | Donchian Channels |
| openbb.ta.ema | Overlap | Exponential Moving Average |
| openbb.ta.fib | Other | Fibonacci Retracement |
| openbb.ta.fisher | Momentum | Fisher Transform |
| openbb.ta.hma | Overlap | Hull Moving Average |
| openbb.ta.kc | Volatility | Keltner Channels |
| openbb.ta.ma | Overlap | Moving Averages (For Charting) |
| openbb.ta.macd | Momentum | Moving Average Convergence/Divergence |
| openbb.ta.obv | Volume | On-Balance Volume |
| openbb.ta.rsi | Momentum | Relative Strength Index |
| openbb.ta.sma | Overlap | Simple Moving Average |
| openbb.ta.stoch | Momentum | Stochastic Oscillator |
| openbb.ta.vwap | Overlap | Volume-Weighted Average Price |
| openbb.ta.wma | Overlap | Weighted Moving Average |
| openbb.ta.zlma | Overlap | Zero-Lag Moving Average |
The syntax for the data argument can be:
-
data = ohlcv_dfWhere functions only require a single column,
data = ohlcv_df['Adj Close'] -
data = openbb.stocks.load("ticker")Target intraday by adding the
intervalargument to theloadsyntax.
Best practice is to deploy the first method because the latter will work only with the commands requiring OHLC+V data as inputs. An error message will be returned if this is the case.
openbb.ta.obv(data = openbb.stocks.load('QQQ'))
| date | OBV |
|---|---|
| 2019-11-15 00:00:00 | 1.84279e+07 |
| 2019-11-18 00:00:00 | 3.67938e+07 |
| 2019-11-19 00:00:00 | 5.37171e+07 |
| 2019-11-20 00:00:00 | 1.70881e+07 |
| 2022-11-15 00:00:00 | -1.09017e+08 |
| 2022-11-16 00:00:00 | -1.57876e+08 |
| 2022-11-17 00:00:00 | -2.13339e+08 |
| 2022-11-18 00:00:00 | -1.59987e+08 |
The error message:
openbb.ta.rsi(data = openbb.stocks.load('QQQ'))
Please send a series and not a DataFrame.
_chart
To display the chart, instead of raw data, add _chart to the syntax before the (arguments).
openbb.ta.obv_chart(data= openbb.stocks.load('QQQ', start_date = '2022-11-18', interval = 5, prepost = True))

Examples
Import Statements
The examples here assume that this code block is at the top of the Python script of Notebook file:
import pandas as pd
from openbb_terminal.sdk import openbb
# %matplotlib inline (uncomment for Jupyter environments)
MA (Moving Averages)
The different types of moving averages, which also are individual functions (e.g., openbb.ta.ema), are available as an argument (ma_type) to the ma command. There are five accepted arguments, they are listed below in brackets:
- Simple (SMA)
- Exponential (EMA)
- Hull (HMA)
- Weighted (WMA)
- Zero-Lag (ZLMA)
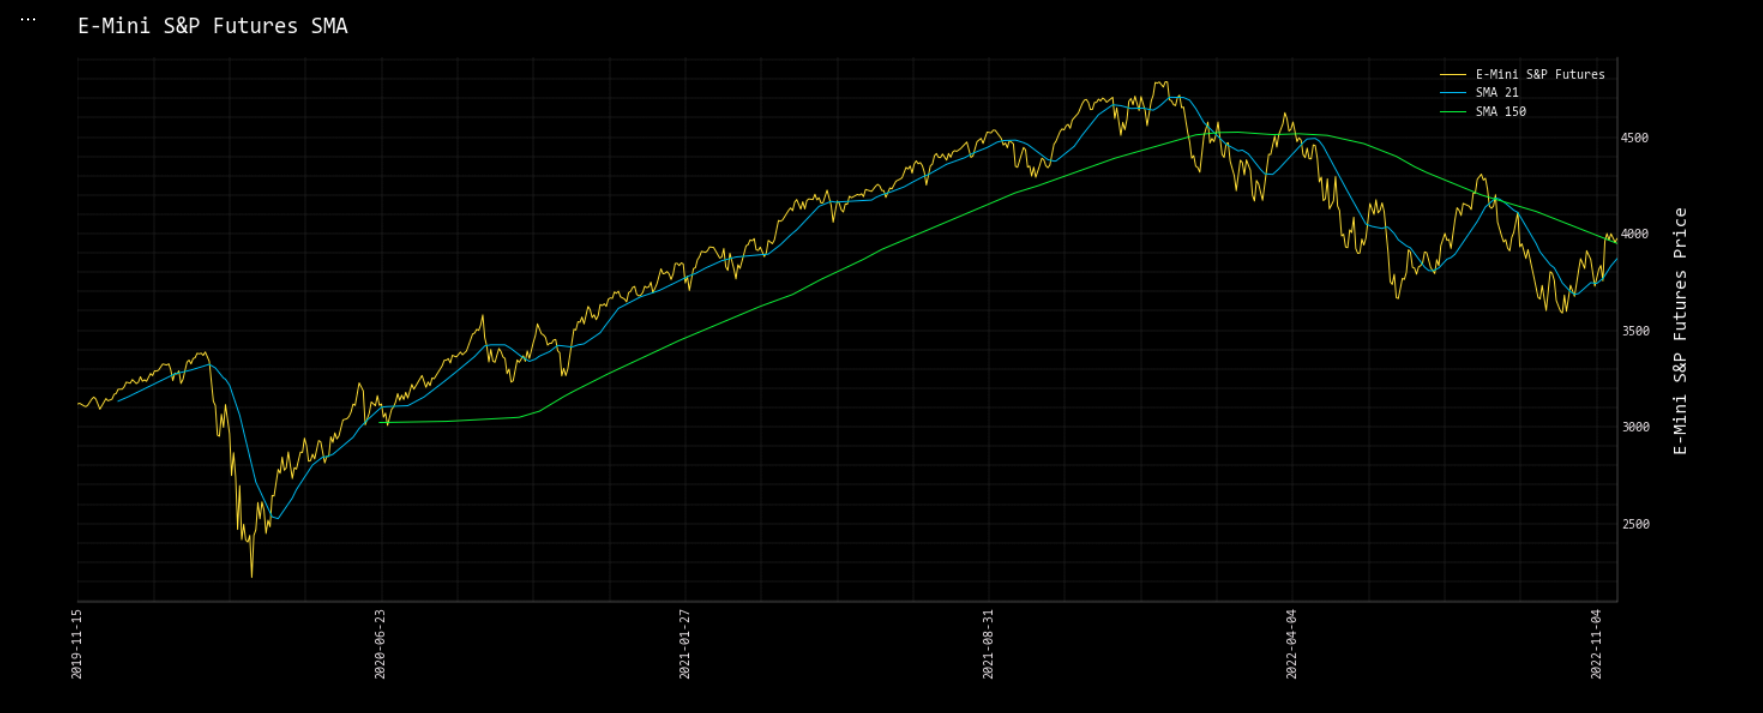
The window argument anticipates a list of integers representing the interval (minutes, days, weeks, months, etc.) to measure against the timestamp of the DataFrame's index. The example below is a daily timeseries of S&P E-Mini Futures:
es = openbb.stocks.load("ES=F")

openbb.ta.ma_chart(
    data = es['Adj Close'],
    symbol = 'E-Mini S&P Futures',
    ma_type = 'SMA',
    window = [21, 150])
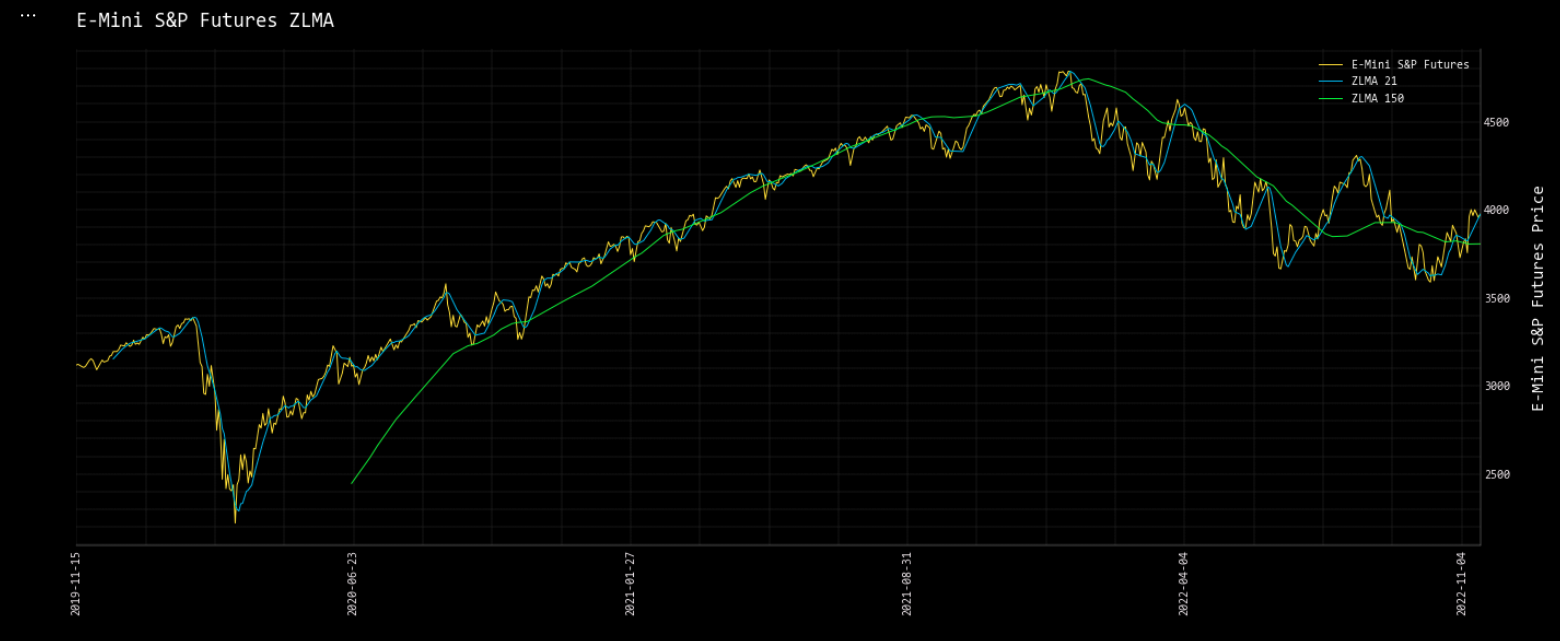
Changing, ma_type, to, ZLMA:
ATR (Average True Range)
The atr command requires OHLC data, the data argument can be the load function.
ticker = 'ES=F'
start = '2000-01-01'

df_atr = openbb.ta.atr(data = openbb.stocks.load(f"{ticker}", start_date = f"{start}", monthly = True), window = 6)

df_atr.tail(5)
| date | ATRe_6 |
|---|---|
| 2022-07-01 00:00:00 | 454.457 |
| 2022-08-01 00:00:00 | 431.612 |
| 2022-09-01 00:00:00 | 469.08 |
| 2022-10-01 00:00:00 | 455.7 |
| 2022-11-01 00:00:00 | 424.5 |
Donchian
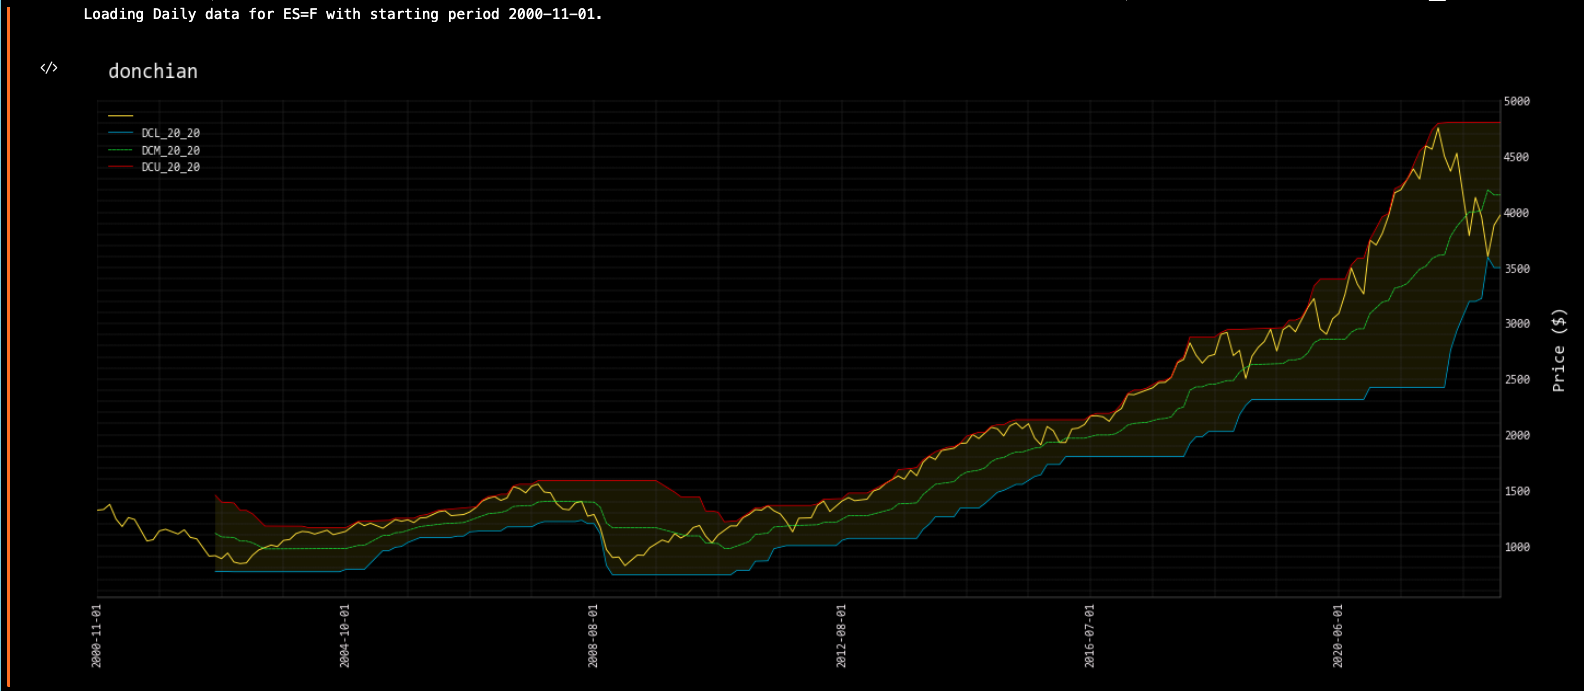
To use the same data for multiple functions, it is more efficient to first load to a Pandas DataFrame:
ticker = 'ES=F'
start = '2000-01-01'
data_df: pd.DataFrame = openbb.stocks.load(f"{ticker}", start_date = f"{start}", monthly = True)

openbb.ta.donchian_chart(data_df)
The output from a function can be joined to the OHLC data:
ticker = 'ES=F'
start = '2000-01-01'
data_df: pd.DataFrame = openbb.stocks.load(f"{ticker}", start_date = f"{start}", monthly = True)

donchian = openbb.ta.donchian(data_df)

data_df = data_df.join(donchian)

data_df.tail(5)
| date | Open | High | Low | Close | Adj Close | Volume | DCL_20_20 | DCM_20_20 | DCU_20_20 |
|---|---|---|---|---|---|---|---|---|---|
| 2022-07-01 00:00:00 | 3782 | 4144 | 3723.75 | 4133.5 | 4133.5 | 3.40941e+07 | 3198 | 4003.12 | 4808.25 |
| 2022-08-01 00:00:00 | 4137.5 | 4327.5 | 3953 | 3956.5 | 3956.5 | 3.84732e+07 | 3225 | 4016.62 | 4808.25 |
| 2022-09-01 00:00:00 | 3958 | 4158 | 3595.25 | 3601.5 | 3601.5 | 4.68698e+07 | 3595.25 | 4201.75 | 4808.25 |
| 2022-10-01 00:00:00 | 3593.25 | 3924.25 | 3502 | 3883 | 3883 | 4.80686e+07 | 3502 | 4155.12 | 4808.25 |
| 2022-11-01 00:00:00 | 3884 | 4050.75 | 3704.25 | 3974 | 3974 | 2.65215e+07 | 3502 | 4155.12 | 4808.25 |