mirror of
https://github.com/OpenBB-finance/OpenBB.git
synced 2026-11-03 07:51:49 +00:00
 4ad995fdd0
* add first iteration of content for Terminal Pro

* Update index.md

* Update dashboards.md

* Update folders.md

* Update grouping.md

* Update report.md

* Update templates.md

* Update quick-start.md

* Update index.md

* Update index.md

* Update home.md

* Update news.md

* Update index.md

* Update index.md

* Update index.md

* Update data-provider.md

* Update chat-with-widget.md

* Update data-manipulation.md

* Update forecasting.md

* fix: images self closing tags

* fix: only pro visitors can see pro

* inter font

* improve SEO content and restructuring

* add new package for toggle on tutorials

* move folder around

* improve main page of each prod

* small updates and improvements

* fix logo above

* small improvement in headtitle for portfolio funcs

* fix typos from OpenAI's GPT-4

* fix _category_ json

* remove generic SEO words

* add script that generates SEO for documentation

* add missing file

* remove sdk warning message

* fix links for andrew

---------

Co-authored-by: jose-donato <zmcdonato@gmail.com>
Co-authored-by: jose-donato <43375532+jose-donato@users.noreply.github.com>
Co-authored-by: andrewkenreich <andrew.kenreich@gmail.com>
183 lines
8.9 KiB
Markdown
Vendored
183 lines
8.9 KiB
Markdown
Vendored
---
|
||
title: Quantitative Analysis
|
||
description: The page provides a comprehensive guide on how to use the 'qa' module
|
||
of the Terminal's Quantitative Analysis menu for SDK environment. It contains detailed
|
||
information about the grouping of functions into categories, examples on their usage,
|
||
and how they provide users more ways to interact with the function library.
|
||
keywords:
|
||
- Quantitative Analysis
|
||
- SDK Environment
|
||
- Library of Functions
|
||
- Code Completion
|
||
- Statistics
|
||
- Risk Management
|
||
- API Integration
|
||
- Data Relation
|
||
- Nasdaq Data Link API
|
||
- Risk-Adjusted Return
|
||
- openbb.qa
|
||
---
|
||
|
||
import HeadTitle from '@site/src/components/General/HeadTitle.tsx';
|
||
|
||
<HeadTitle title="Quantitative Analysis - Intros - Usage | OpenBB SDK Docs" />
|
||
|
||
The `qa` module is the Terminal's Quantitative Analysis menu for the SDK environment. It provides users with more ways to interact with the library of functions, and provides cross-disciplinary utility. To activate the code completion for the menu, enter `.` after, `openbb.qa`.
|
||
|
||
## How to Use
|
||
|
||
The functions of the `qa` module are grouped into categories, listed below along with a short description.
|
||
|
||
|Path |Type |Description |
|
||
|:----------|:----------:|--------------------:|
|
||
|openbb.qa.acf |Plot |Plots Auto and Partial Correlation of Returns and Change in Returns|
|
||
|openbb.qa.bw |Plot |Box and Whisker Plot |
|
||
|openbb.qa.calculate_adjusted_var |Risk |Calculates VaR, adjusted for skew and kurtosis (Cornish-Fisher-Expansion) |
|
||
|openbb.qa.cdf |Plot |Plots the Cumulative Distribution Function |
|
||
|openbb.qa.cusum |Plot |Plots the Cumulative Sum Algorithm |
|
||
|openbb.qa.decompose |Plot |Decomposition in Cyclic-Trend, Season & Residuals of Prices |
|
||
|openbb.qa.es |Statistics |Expected Shortfall per percentile |
|
||
|openbb.qa.kurtosis |Rolling Metrics |Rolling Kurtosis of Distribution of Prices |
|
||
|openbb.qa.line |Plot |Customizable Line Plot, With Annotations |
|
||
|openbb.qa.normality |Statistics |Normality Statistics and Tests |
|
||
|openbb.qa.omega |Risk |Omega Ratio (Risk/Return Performance Measure) |
|
||
|openbb.qa.quantile |Rolling Metrics |Rolling Median and Quantile of Prices |
|
||
|openbb.qa.qqplot |Plot |QQ Plot for Data Against Normal Quantiles |
|
||
|openbb.qa.rolling |Rolling Metrics |Rolling Mean and Standard Deviation of Prices |
|
||
|openbb.qa.sharpe |Risk |Sharpe Ratio (Measure of Risk-Adjusted Return) |
|
||
|openbb.qa.skew |Rolling Metrics |Rolling Skewness of Distribution of Prices |
|
||
|openbb.qa.sortino |Risk |Sortino Ratio Risk Adjustment Metric |
|
||
|openbb.qa.spread |Rolling Metrics |Rolling Variance and Standard Deviation of Prices |
|
||
|openbb.qa.summary |Statistics |A Brief Summary of Statistics for the DataFrame |
|
||
|openbb.qa.unitroot |Statistics |Normality Statistics and Tests |
|
||
|openbb.qa.var |Risk |Value at Risk |
|
||
|
||
## Examples
|
||
|
||
### Import Statements
|
||
|
||
The examples below will assume that the following statements are included in the first block of code:
|
||
|
||
```python
|
||
import quandl
|
||
import pandas as pd
|
||
from openbb_terminal.sdk import openbb
|
||
from openbb_terminal import config_terminal as cfg
|
||
|
||
# %matplotlib inline (uncomment if using a Jupyter environment)
|
||
```
|
||
|
||
### Get Data
|
||
|
||
This example collects data from Nasdaq Data Link, and requires registering for a free API key. Qunadl is the Python client for the Nasdaq Data Link API.
|
||
|
||
```python
|
||
shiller_pe_rdiff = quandl.get('MULTPL/SHILLER_PE_RATIO_MONTH', collapse = 'monthly', transform = 'rdiff', api_key = cfg.API_KEY_QUANDL)
|
||
shiller_pe_rdiff.rename(columns={'Value':'P/E % Change'}, inplace = True)
|
||
shiller_pe_ratio = quandl.get('MULTPL/SHILLER_PE_RATIO_MONTH', collapse = 'monthly', api_key = cfg.API_KEY_QUANDL)
|
||
shiller_pe_ratio.rename(columns={'Value':'P/E Ratio'}, inplace = True)
|
||
|
||
sp500_inf_adj = quandl.get('MULTPL/SP500_INFLADJ_MONTH', collapse = 'monthly', api_key = cfg.API_KEY_QUANDL)
|
||
sp500_inf_adj.rename(columns = {'Value': 'S&P Inflation-Adjusted Value'}, inplace = True)
|
||
sp500_inf_adj_rdiff = quandl.get('MULTPL/SP500_INFLADJ_MONTH', collapse = 'monthly', transform = 'rdiff', api_key = cfg.API_KEY_QUANDL)
|
||
sp500_inf_adj_rdiff.rename(columns = {'Value':'S&P 500 % Change'}, inplace = True)
|
||
|
||
shiller_pe = shiller_pe_ratio.join(shiller_pe_rdiff)
|
||
sp500_inf_adj = sp500_inf_adj.join(sp500_inf_adj_rdiff)
|
||
|
||
sp500_df = sp500_inf_adj.join(shiller_pe)
|
||
|
||
sp500_df
|
||
```
|
||
|
||
| Date | S&P Inflation-Adjusted Value | S&P 500 % Change | P/E Ratio | P/E % Change |
|
||
|:--------------------|-------------------------------:|-------------------:|------------:|---------------:|
|
||
| 2022-08-31 00:00:00 | 3955 | 0.0092504 | 29.64 | 0.022069 |
|
||
| 2022-09-30 00:00:00 | 3585.62 | -0.0933957 | 26.84 | -0.0944669 |
|
||
| 2022-10-31 00:00:00 | 3871.98 | 0.0798635 | 28.53 | 0.0629657 |
|
||
| 2022-11-30 00:00:00 | 3856.1 | -0.00410126 | 28.37 | -0.00560813 |
|
||
|
||
This particular data series contains 150 years of monthly values. It is among the longest uninterrupted timeseries available in the public domain, and it is cited frequently in macroeconomic research.
|
||
|
||
### Summary
|
||
|
||
Get a summary of statistics for each column with `qa.summary`:
|
||
|
||
```python
|
||
openbb.qa.summary(sp500_df)
|
||
```
|
||
|
||
| | S&P Inflation-Adjusted Value | S&P 500 % Change | P/E Ratio | P/E % Change |
|
||
|:------|-------------------------------:|-------------------:|------------:|---------------:|
|
||
| count | 1823 | 1822 | 1822 | 1821 |
|
||
| mean | 697.396 | 0.0028703 | 16.9914 | 0.00137084 |
|
||
| std | 834.501 | 0.0424378 | 7.07094 | 0.0412196 |
|
||
| min | 80.31 | -0.264738 | 4.78 | -0.268992 |
|
||
| 10% | 152.404 | -0.0447494 | 9.31 | -0.0449735 |
|
||
| 25% | 203.47 | -0.0172803 | 11.7 | -0.0183028 |
|
||
| 50% | 309.83 | 0.00553122 | 15.895 | 0.00446999 |
|
||
| 75% | 778.42 | 0.0260009 | 20.5575 | 0.0246575 |
|
||
| 90% | 1907.87 | 0.04505 | 26.467 | 0.0426357 |
|
||
| max | 4786.79 | 0.514085 | 44.19 | 0.511986 |
|
||
| var | 696392 | 0.00180097 | 49.9982 | 0.00169906 |
|
||
|
||
### Spread
|
||
|
||
Add the variance and standard deviation, over a specified window (three-months), to the DataFrame:
|
||
|
||
```python
|
||
std,variance = openbb.qa.spread(data = sp500_df['S&P 500 % Change'], window = 3)
|
||
std.rename(columns = {'STDEV_3':'Three-Month Standard Deviation'}, inplace = True)
|
||
variance.rename(columns = {'VAR_3': 'Three-Month Variance'}, inplace =True)
|
||
sp500_df = sp500_df.join([std,variance])
|
||
sp500_df.rename_axis('date', inplace = True)
|
||
sp500_df.tail(2)
|
||
```
|
||
|
||
| date | S&P Inflation-Adjusted Value | S&P 500 % Change | P/E Ratio | P/E % Change | Three-Month Standard Deviation | Three-Month Variance |
|
||
|:--------------------|-------------------------------:|-------------------:|------------:|---------------:|---------------------------------:|-----------------------:|
|
||
| 2022-10-31 00:00:00 | 3871.98 | 0.0798635 | 28.53 | 0.0629657 | 0.0871217 | 0.00759019 |
|
||
| 2022-11-30 00:00:00 | 3856.1 | -0.00410126 | 28.37 | -0.00560813 | 0.0866432 | 0.00750705 |
|
||
|
||
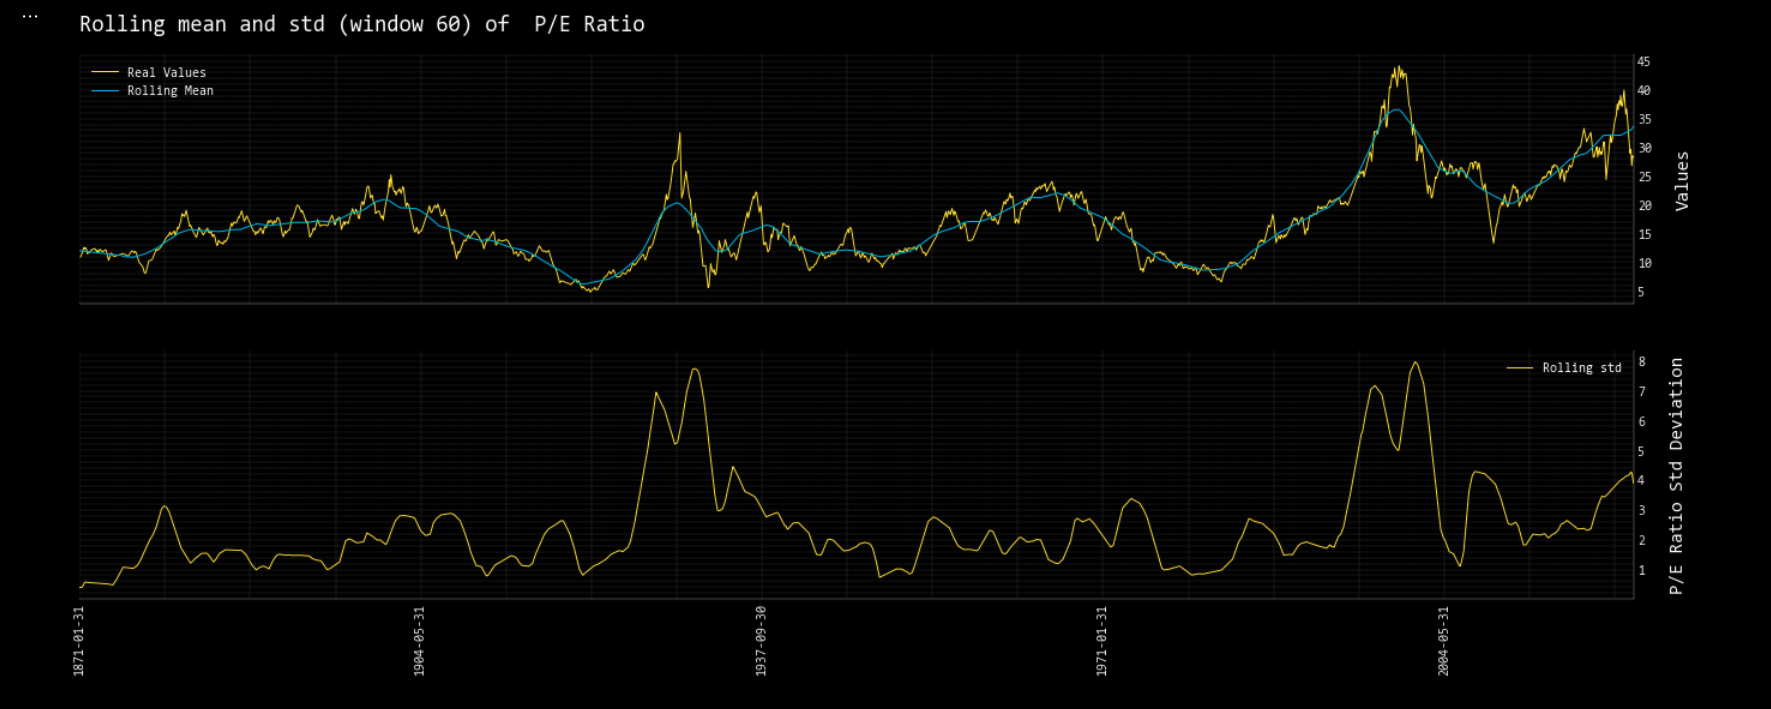
The rolling mean average and standard deviation is calculated with the `rolling` command. Adding, `_chart`, to this will return an inline chart within a Jupyter Notebook. For the example below, window, `60`, represents a five-year period.
|
||
|
||
### Rolling
|
||
|
||
```python
|
||
openbb.qa.rolling_chart(sp500_df, target = 'P/E Ratio', window = 60, symbol = '')
|
||
```
|
||
|
||
|
||
|
||
### Unit Root Test
|
||
|
||
Perform a unit root test with `unitroot`:
|
||
|
||
```python
|
||
help(openbb.qa.unitroot)
|
||
|
||
Parameters
|
||
----------
|
||
data : pd.DataFrame
|
||
DataFrame of target variable
|
||
fuller_reg : str
|
||
Type of regression of ADF test. Can be ‘c’,’ct’,’ctt’,’nc’ 'c' - Constant and t - trend order
|
||
kpss_reg : str
|
||
Type of regression for KPSS test. Can be ‘c’,’ct'
|
||
|
||
Returns
|
||
-------
|
||
pd.DataFrame
|
||
Dataframe with results of ADF test and KPSS test
|
||
|
||
openbb.qa.unitroot(sp500_df['P/E % Change'])
|
||
```
|
||
|
||
| | ADF | KPSS |
|
||
|:---------------|---------------:|:--------------------|
|
||
| Test Statistic | -10.7075 | 0.34061374135067696 |
|
||
| P-Value | 3.3972e-19 | 0.1 |
|
||
| NLags | 20 | 2 |
|
||
| Nobs | 1800 | |
|
||
| ICBest | -6491.14 | |
|