mirror of
https://github.com/OpenBB-finance/OpenBB.git
synced 2026-11-02 23:41:27 +00:00
 757fc57174
* update Terminal about URLs and some other broken links

* ruff

* intro

* changing the heading levels

* dependency management sections

* structure

* developer guides

* structure

* contributor guides

* keywords and descriptions

* broken urls

* cool cards

* Cool cards (#5727)

* tidy up terminal/content

* some more tidy up

* fix styling for platform that was missing

* more tidy up

* improve color for dark and light mode

* create new reference card for more basic cards

* rename back to menus

* implement all index.md for terminal, except reference

* improve bot title

* more refactoring

* fix remaining index

* header styling

* more styling

* heheheheheheeh

* Revert "heheheheheheeh"

This reverts commit 7d095fcfd2.

* Ccards (#5733)

* links

* more links

* improved styling and chevron aligned to title

* fix index.mdx urls for Terminal

* update package.json

* update index.mdx

* fix generation

* spelling

* toolkit_extensions

* update data extensions

* couple of links

* add tiingo to data extensions list

---------

Co-authored-by: hjoaquim <h.joaquim@campus.fct.unl.pt>
Co-authored-by: andrewkenreich <andrew.kenreich@gmail.com>
Co-authored-by: DidierRLopes <dro.lopes@campus.fct.unl.pt>
Co-authored-by: James Maslek <jmaslek11@gmail.com>
668 lines
30 KiB
Markdown
Vendored
668 lines
30 KiB
Markdown
Vendored
---
|
|
title: Forecast
|
|
description: A comprehensive guide exploring the Forecast menu, a machine learning
|
|
toolkit providing high-level, state-of-the-art, components.
|
|
toolkit providing high-level components for quickly providing state-of-the-art results.
|
|
Features include Data Loading, Data Exploration, Feature Engineering, Time Series
|
|
Forecasting, Anomaly Detection, and Miscellaneous AI Tools. This page presents real-world
|
|
examples and workflows for beginners and advanced users.
|
|
keywords:
|
|
- Docusaurus
|
|
- Metadata
|
|
- Search Engine Optimization
|
|
- Marketing
|
|
- Web page
|
|
- Content
|
|
- Forecast menu
|
|
- Machine learning toolkit
|
|
- Time Series Forecasting
|
|
- Anomaly Detection
|
|
- Feature Engineering
|
|
- Data Exploration
|
|
- Data Loading
|
|
- Dataset
|
|
- AI Tools
|
|
- Whisper
|
|
- YouTube
|
|
---
|
|
|
|
import HeadTitle from '@site/src/components/General/HeadTitle.tsx';
|
|
|
|
<HeadTitle title="Forecast - Menus | OpenBB Terminal Docs" />
|
|
|
|
The Forecast menu is a machine learning toolkit that provides practitioners with high-level, state-of-the-art, components. Classical or deep learning models can be combined with low-level components and fine tuned to build new approaches and custom tuned models. Bring in multiple datasets and train machine learning models with unlimited external factors to see how underlying data may change future forecasting predictions and accuracy.
|
|
|
|
## Usage
|
|
|
|
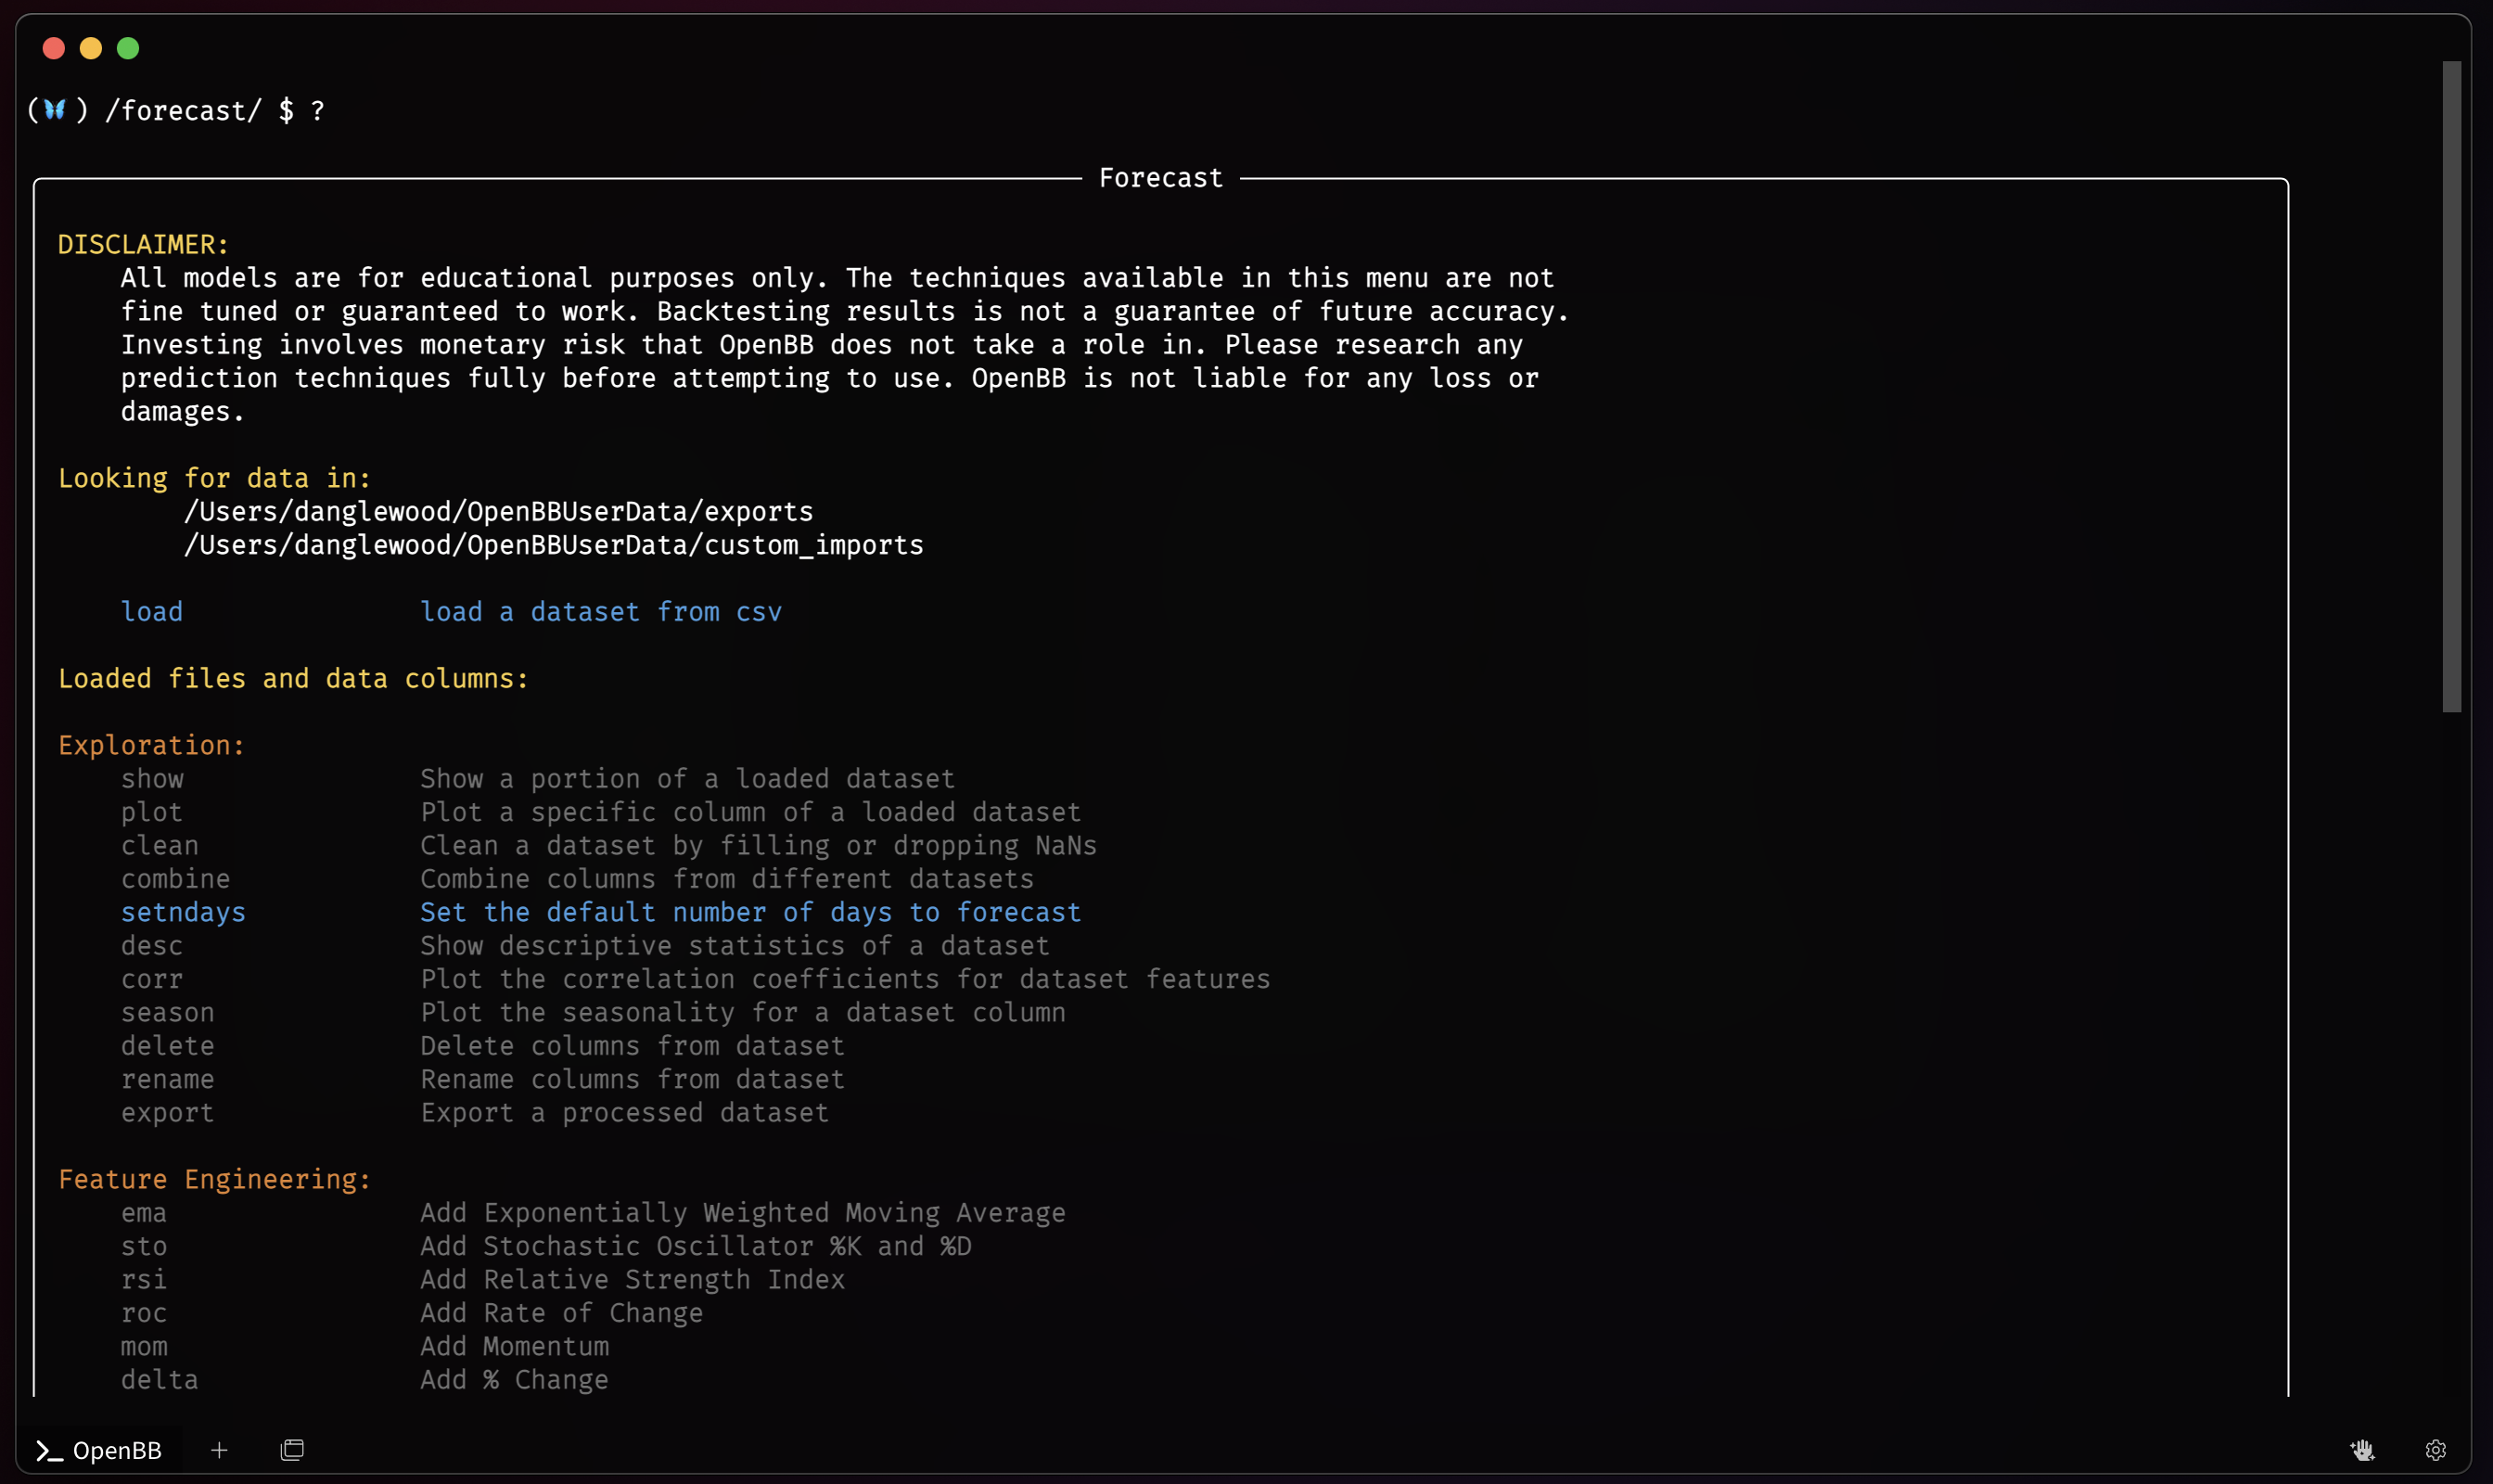
The Forecast menu is entered from the Main menu, `forecast`, or with the absolute path:
|
|
|
|
```console
|
|
/forecast
|
|
```
|
|
|
|
|
|
|
|
There are also methods for entering the menu with a loaded ticker symbol from either of the [`/crypto` menu](/terminal/menus/crypto) and [`/stocks` menu](/terminal/menus/stock)
|
|
|
|
The menu is divided into sections for:
|
|
|
|
- Loading Data
|
|
- Data Exploration
|
|
- Feature Engineering
|
|
- Time Series Forecasting
|
|
- Anomaly Detection
|
|
- Miscellaneous AI Tools
|
|
|
|
and the functions within these groups are described in the following sections.
|
|
|
|
### Loading Data
|
|
|
|
#### With the Load Command
|
|
|
|
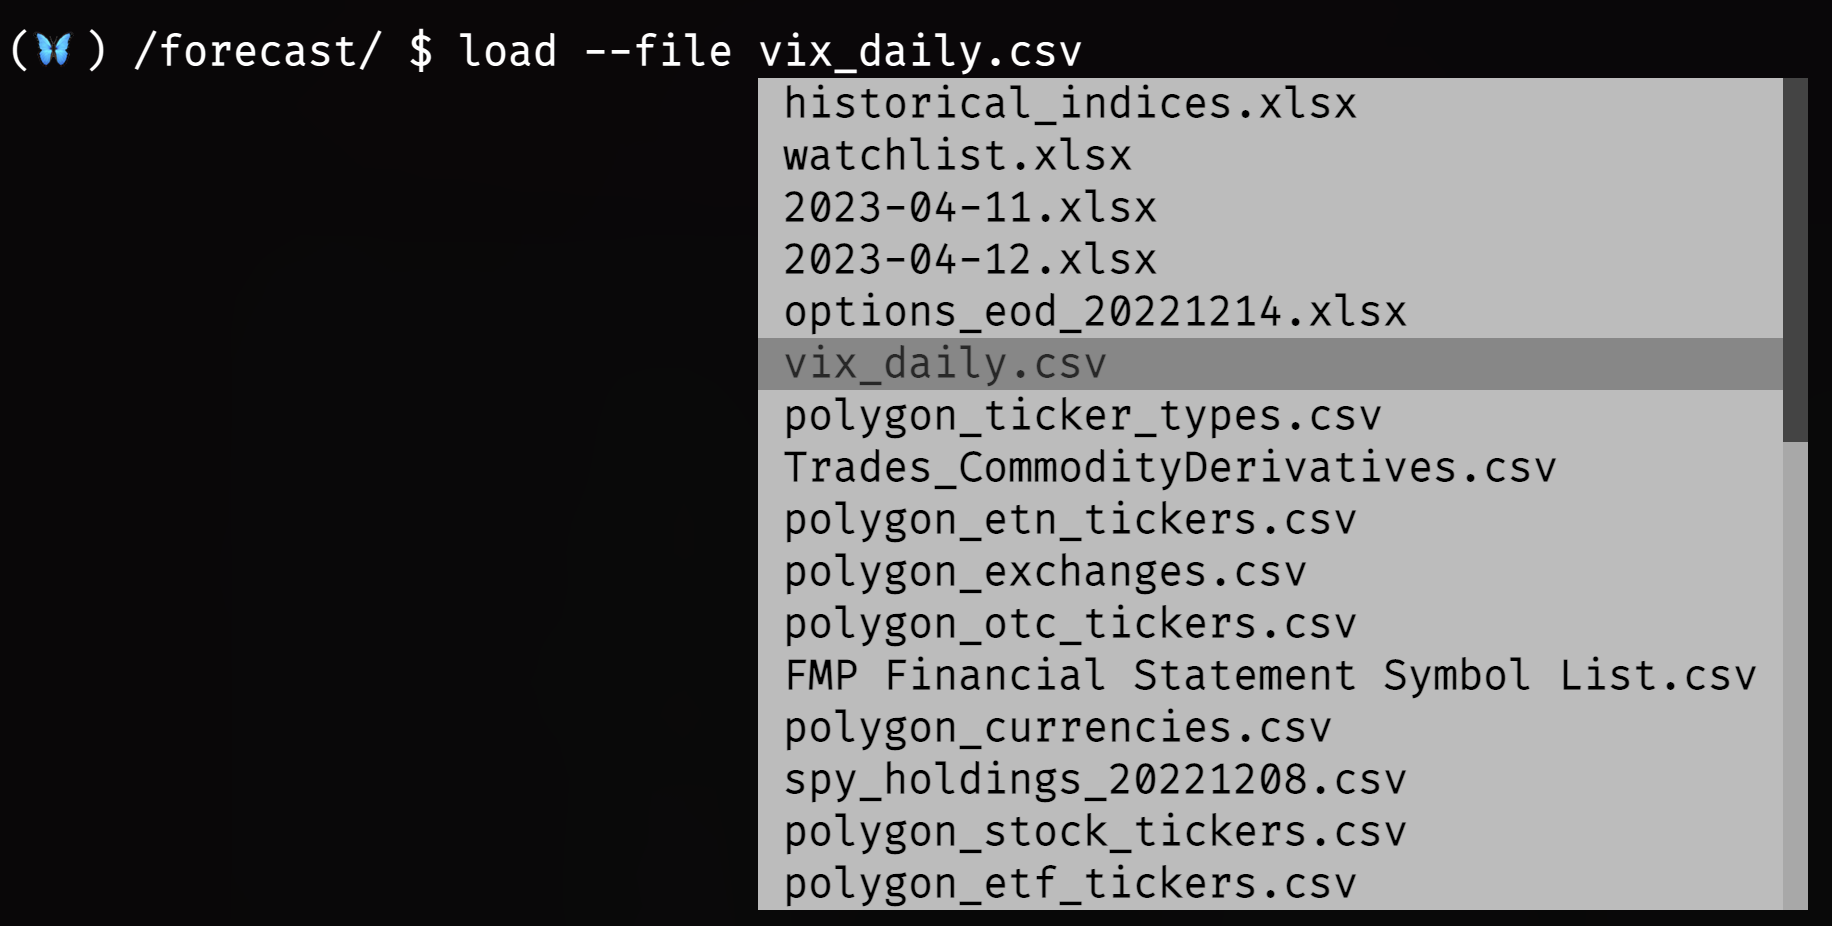
If the Forecast menu has not been entered directly through the [`/crypto`](/website/content/terminal/menus/crypto) or [`/stocks`](/website/content/terminal/menus/stocks) menus, a dataset must be loaded before commencing any work. Use the `load` command to open one from a CSV file placed in the OpenBBUserData folder. The paths where the auto completion engine is looking for files is printed on the screen directly above the `load` command, `Looking for data in:`
|
|
|
|
|
|
|
|
Use the following syntax to load a file and name a dataset, substituting `vix_daily` with the name of the file.
|
|
|
|
```console
|
|
|
|
load --file vix_daily.csv --alias vix
|
|
```
|
|
|
|
To refresh the screen, enter: `?`
|
|
|
|
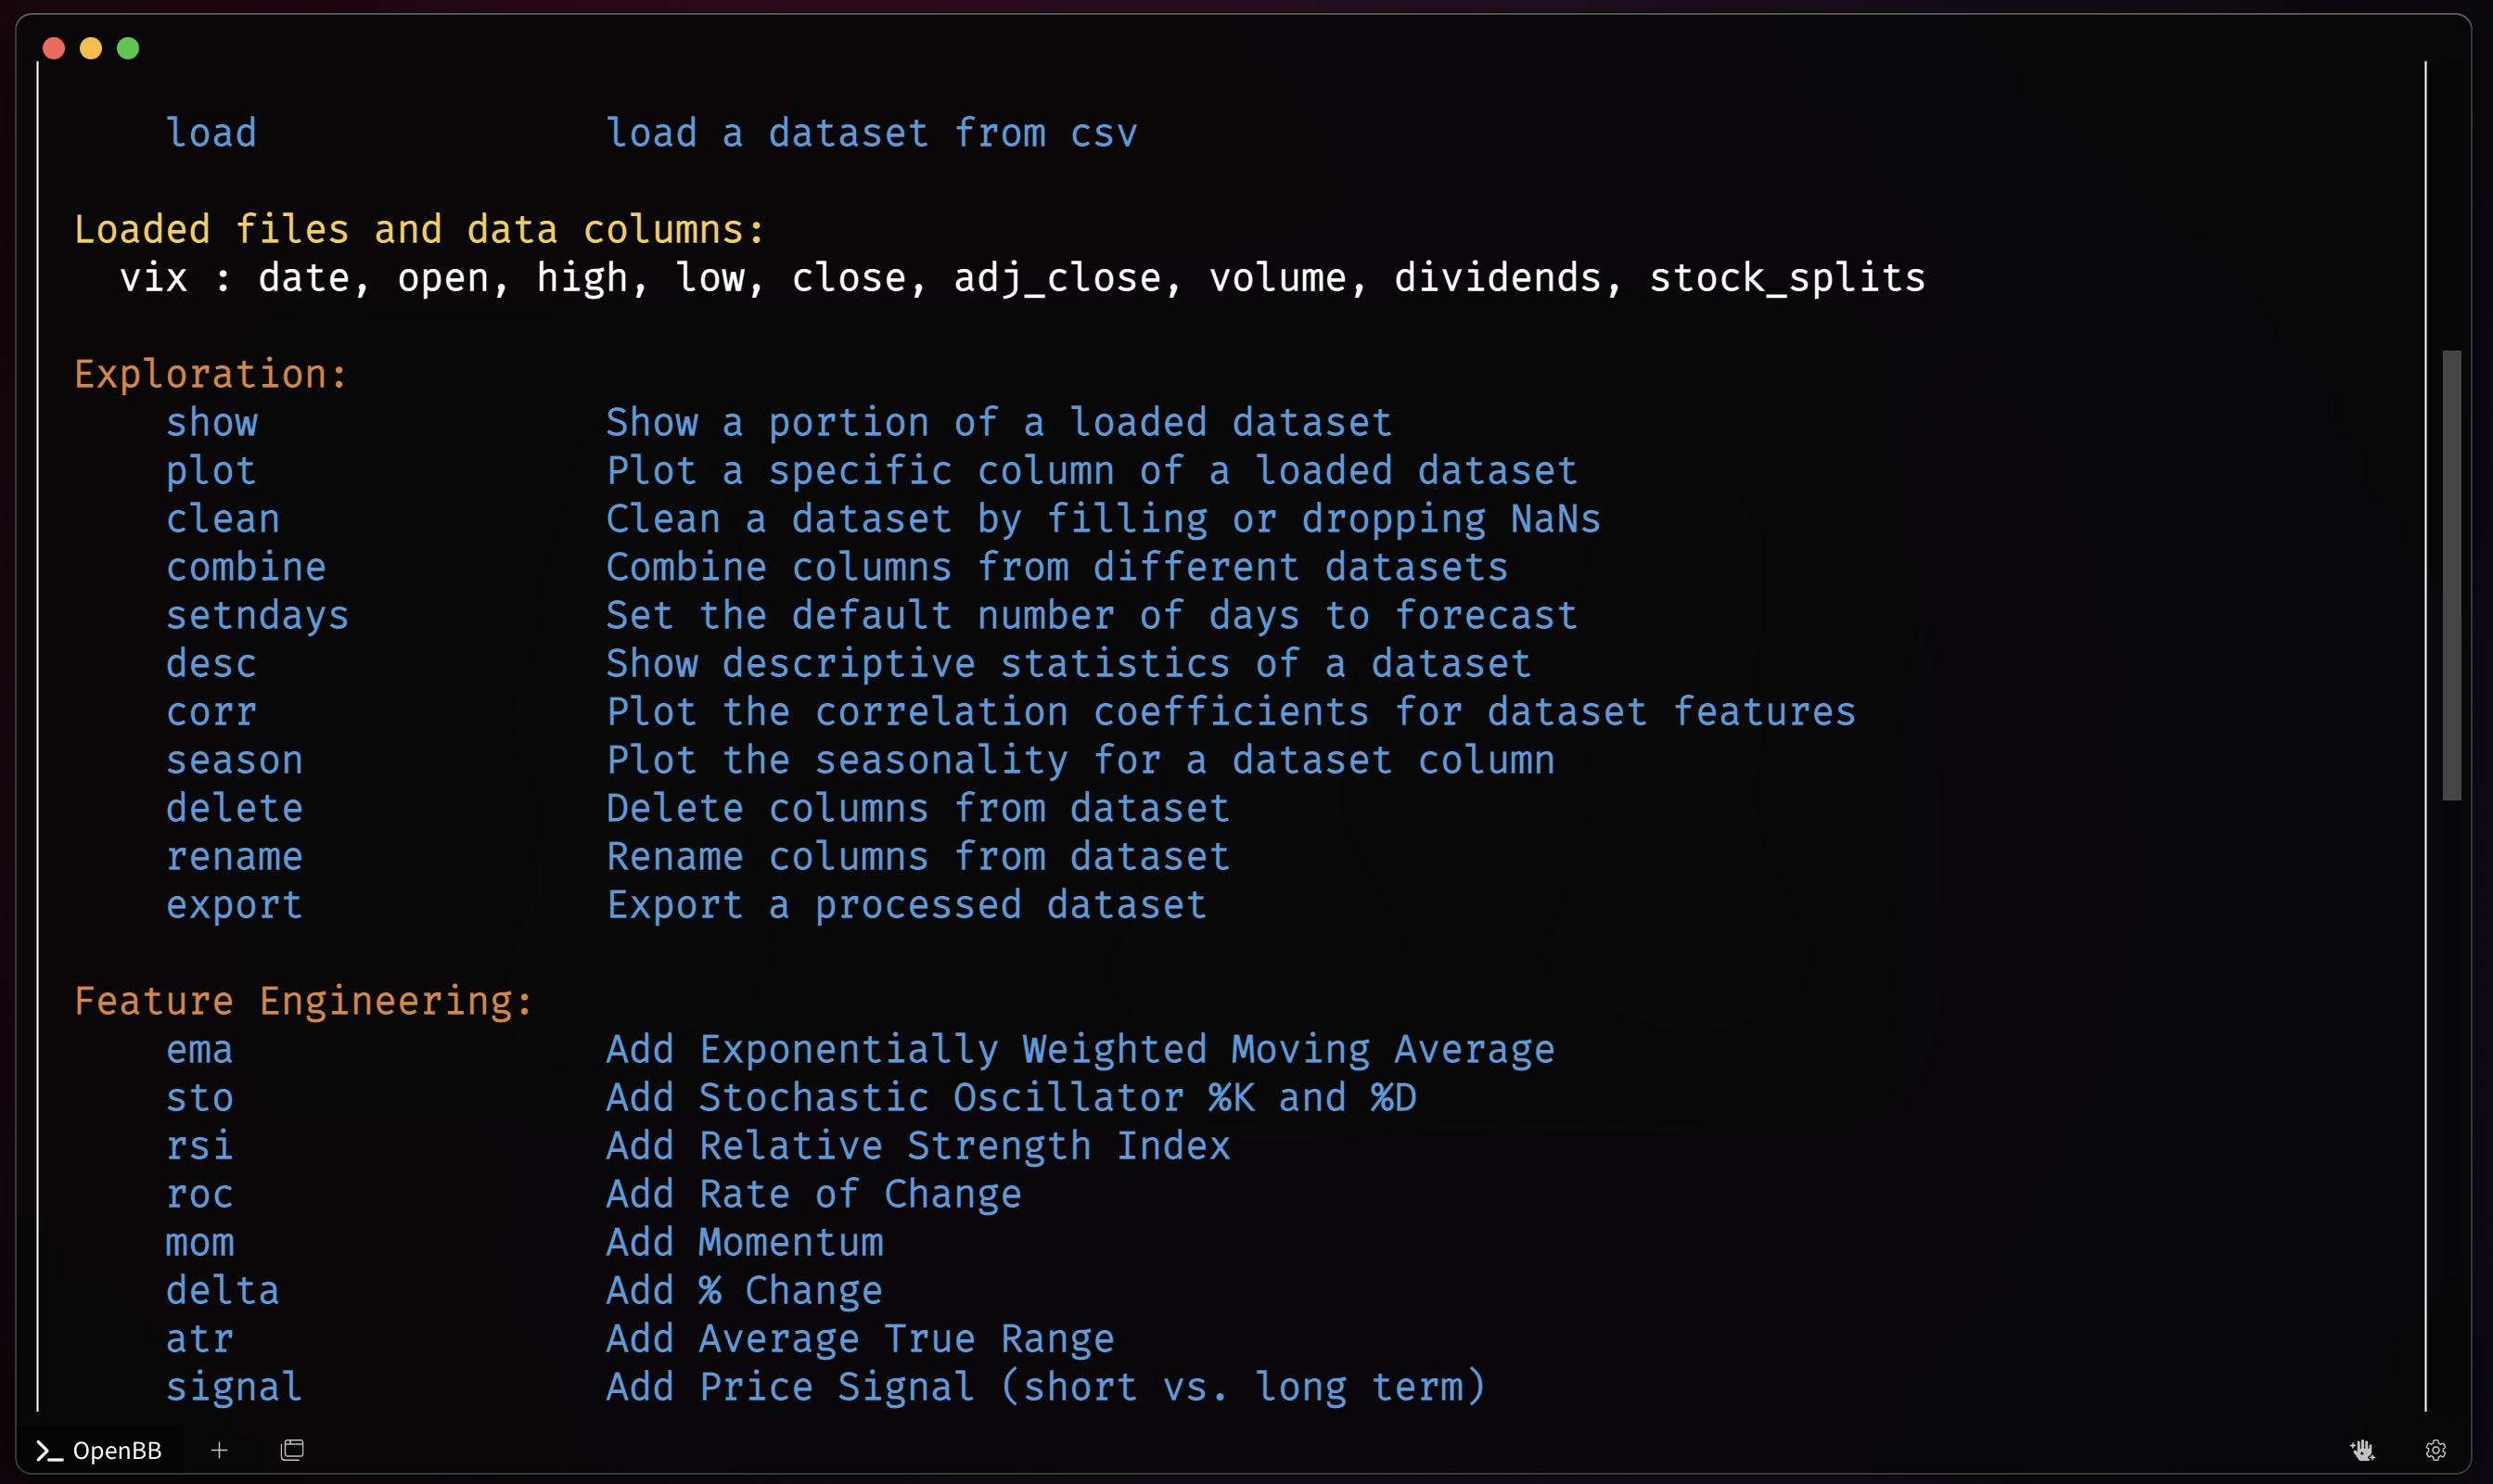
The dataset will be listed under the `load` command and display the column names within it.
|
|
|
|
|
|
|
|
Repeat the process until all desired datasets have been loaded.
|
|
|
|
#### Via the Stocks/Crypto Menus
|
|
|
|
Use the `load` command, according to the nuances of each menu. For example's sake, and to match the starting date of the previously loaded file, it will look like:
|
|
|
|
```console
|
|
/stocks/load SPY --start 1997-01-01/forecast
|
|
```
|
|
|
|
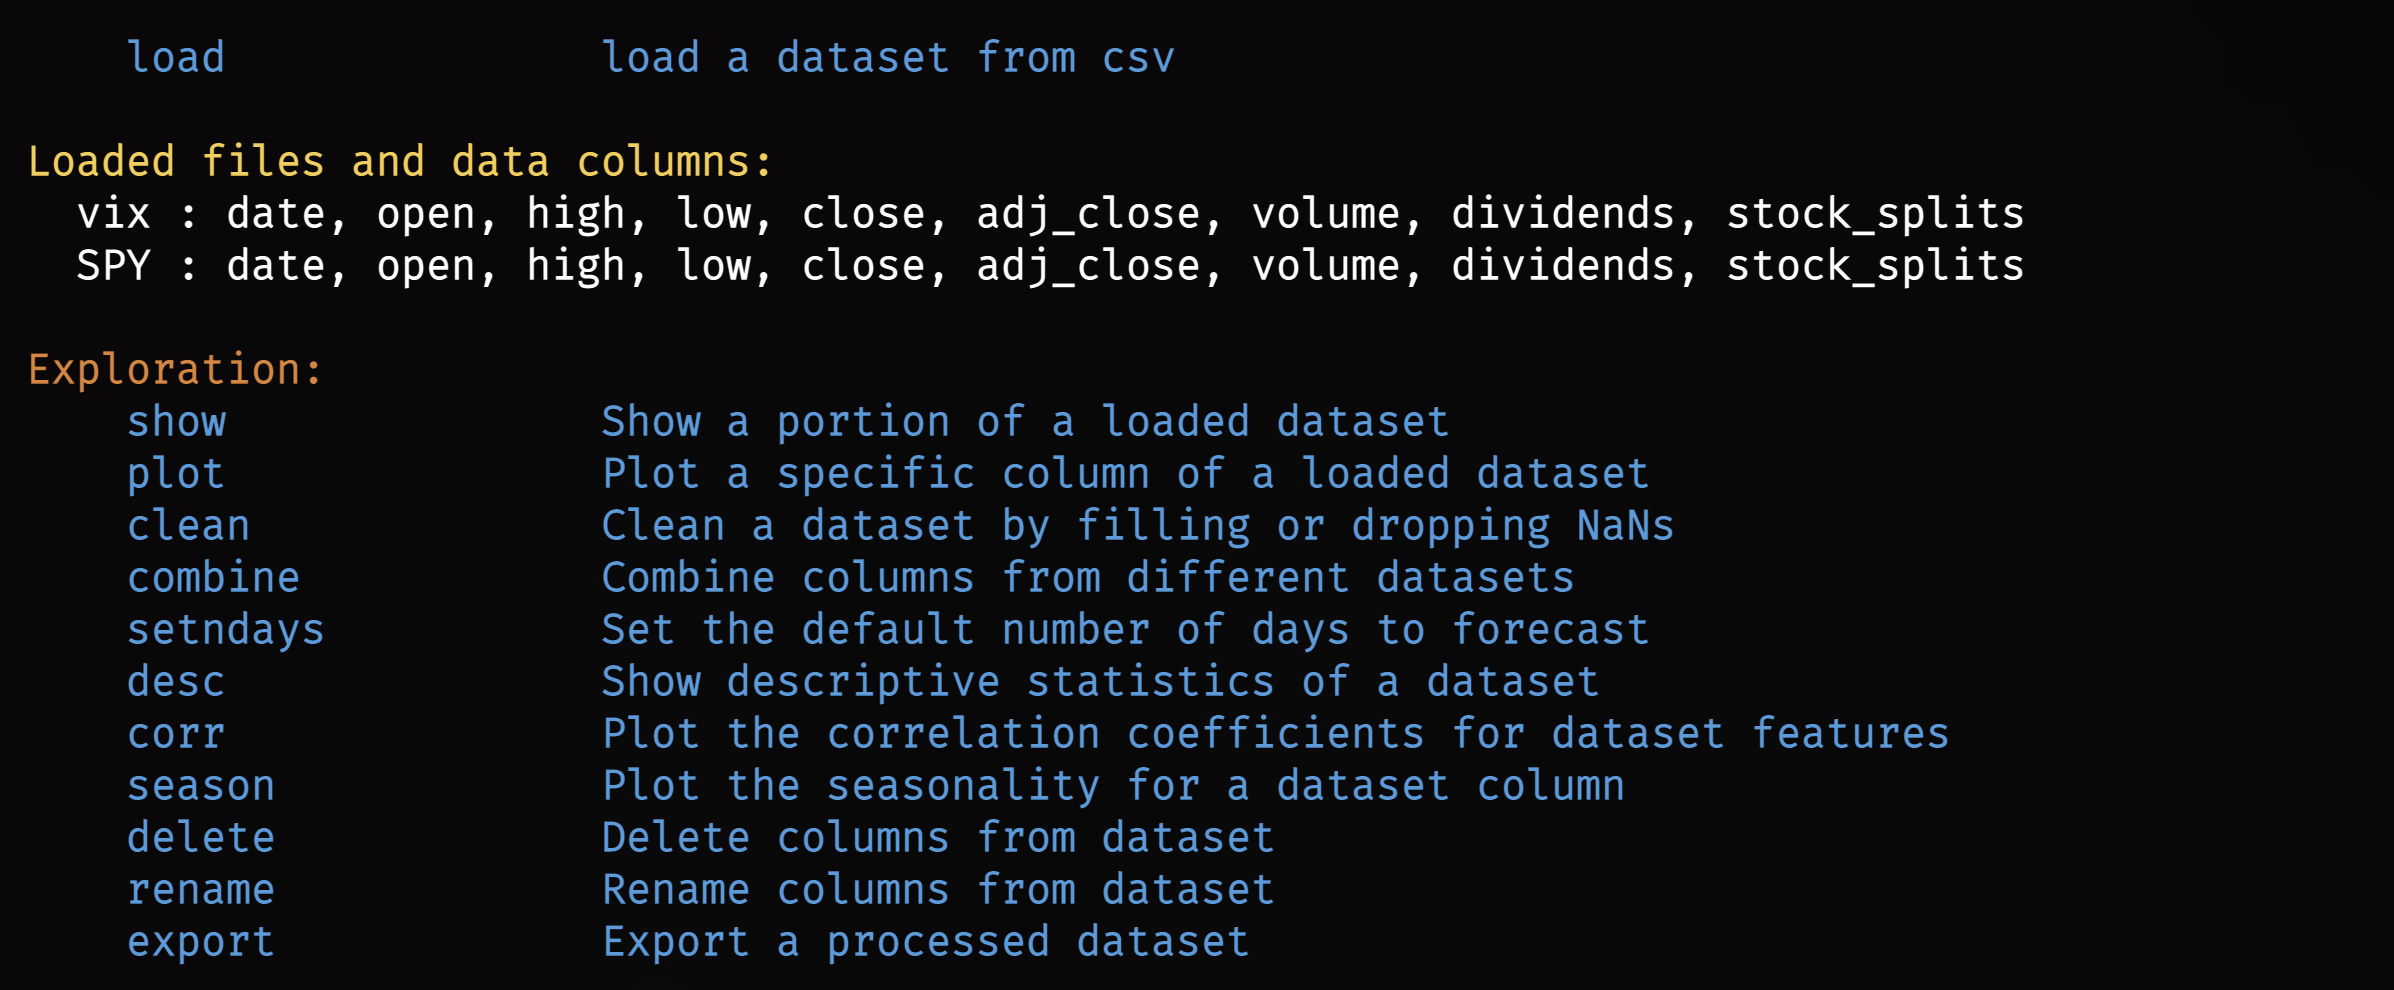
Combine these two methods an unlimited number of times for building a more complex model and forecast.
|
|
|
|
|
|
|
|
With some data loaded, the first series of tools are for inspecting, managing, and exporting the sets.
|
|
|
|
### Exploration
|
|
|
|
The exploration functions are listed in the table below, along with a short description.
|
|
|
|
|Function |Description |
|
|
|:--------|-----------:|
|
|
|clean |Clean a dataset by filling or dropping NaNs. |
|
|
|combine |Combine columns from different datasets. |
|
|
|corr |Plot the correlation coefficients for dataset features. |
|
|
|delete |Delete columns from dataset. |
|
|
|desc |Show descriptive statistics of a dataset. |
|
|
|export |Export a processed dataset. |
|
|
|plot |Plot a specific columns of a loaded dataset. |
|
|
|rename |Rename columns from dataset. |
|
|
|season |Plot the seasonality for a dataset column. |
|
|
|setndays |Set the default number of days to forecast. |
|
|
|show |Show a portion of a loaded dataset. |
|
|
|
|
#### Combine
|
|
|
|
When running a model, all targeted columns must be within the same dataset. Use the `combine` command to accomplish this by merging one column with another dataset.
|
|
|
|
```console
|
|
combine --dataset SPY -c vix.high
|
|
combine --dataset SPY -c vix.low
|
|
```
|
|
|
|
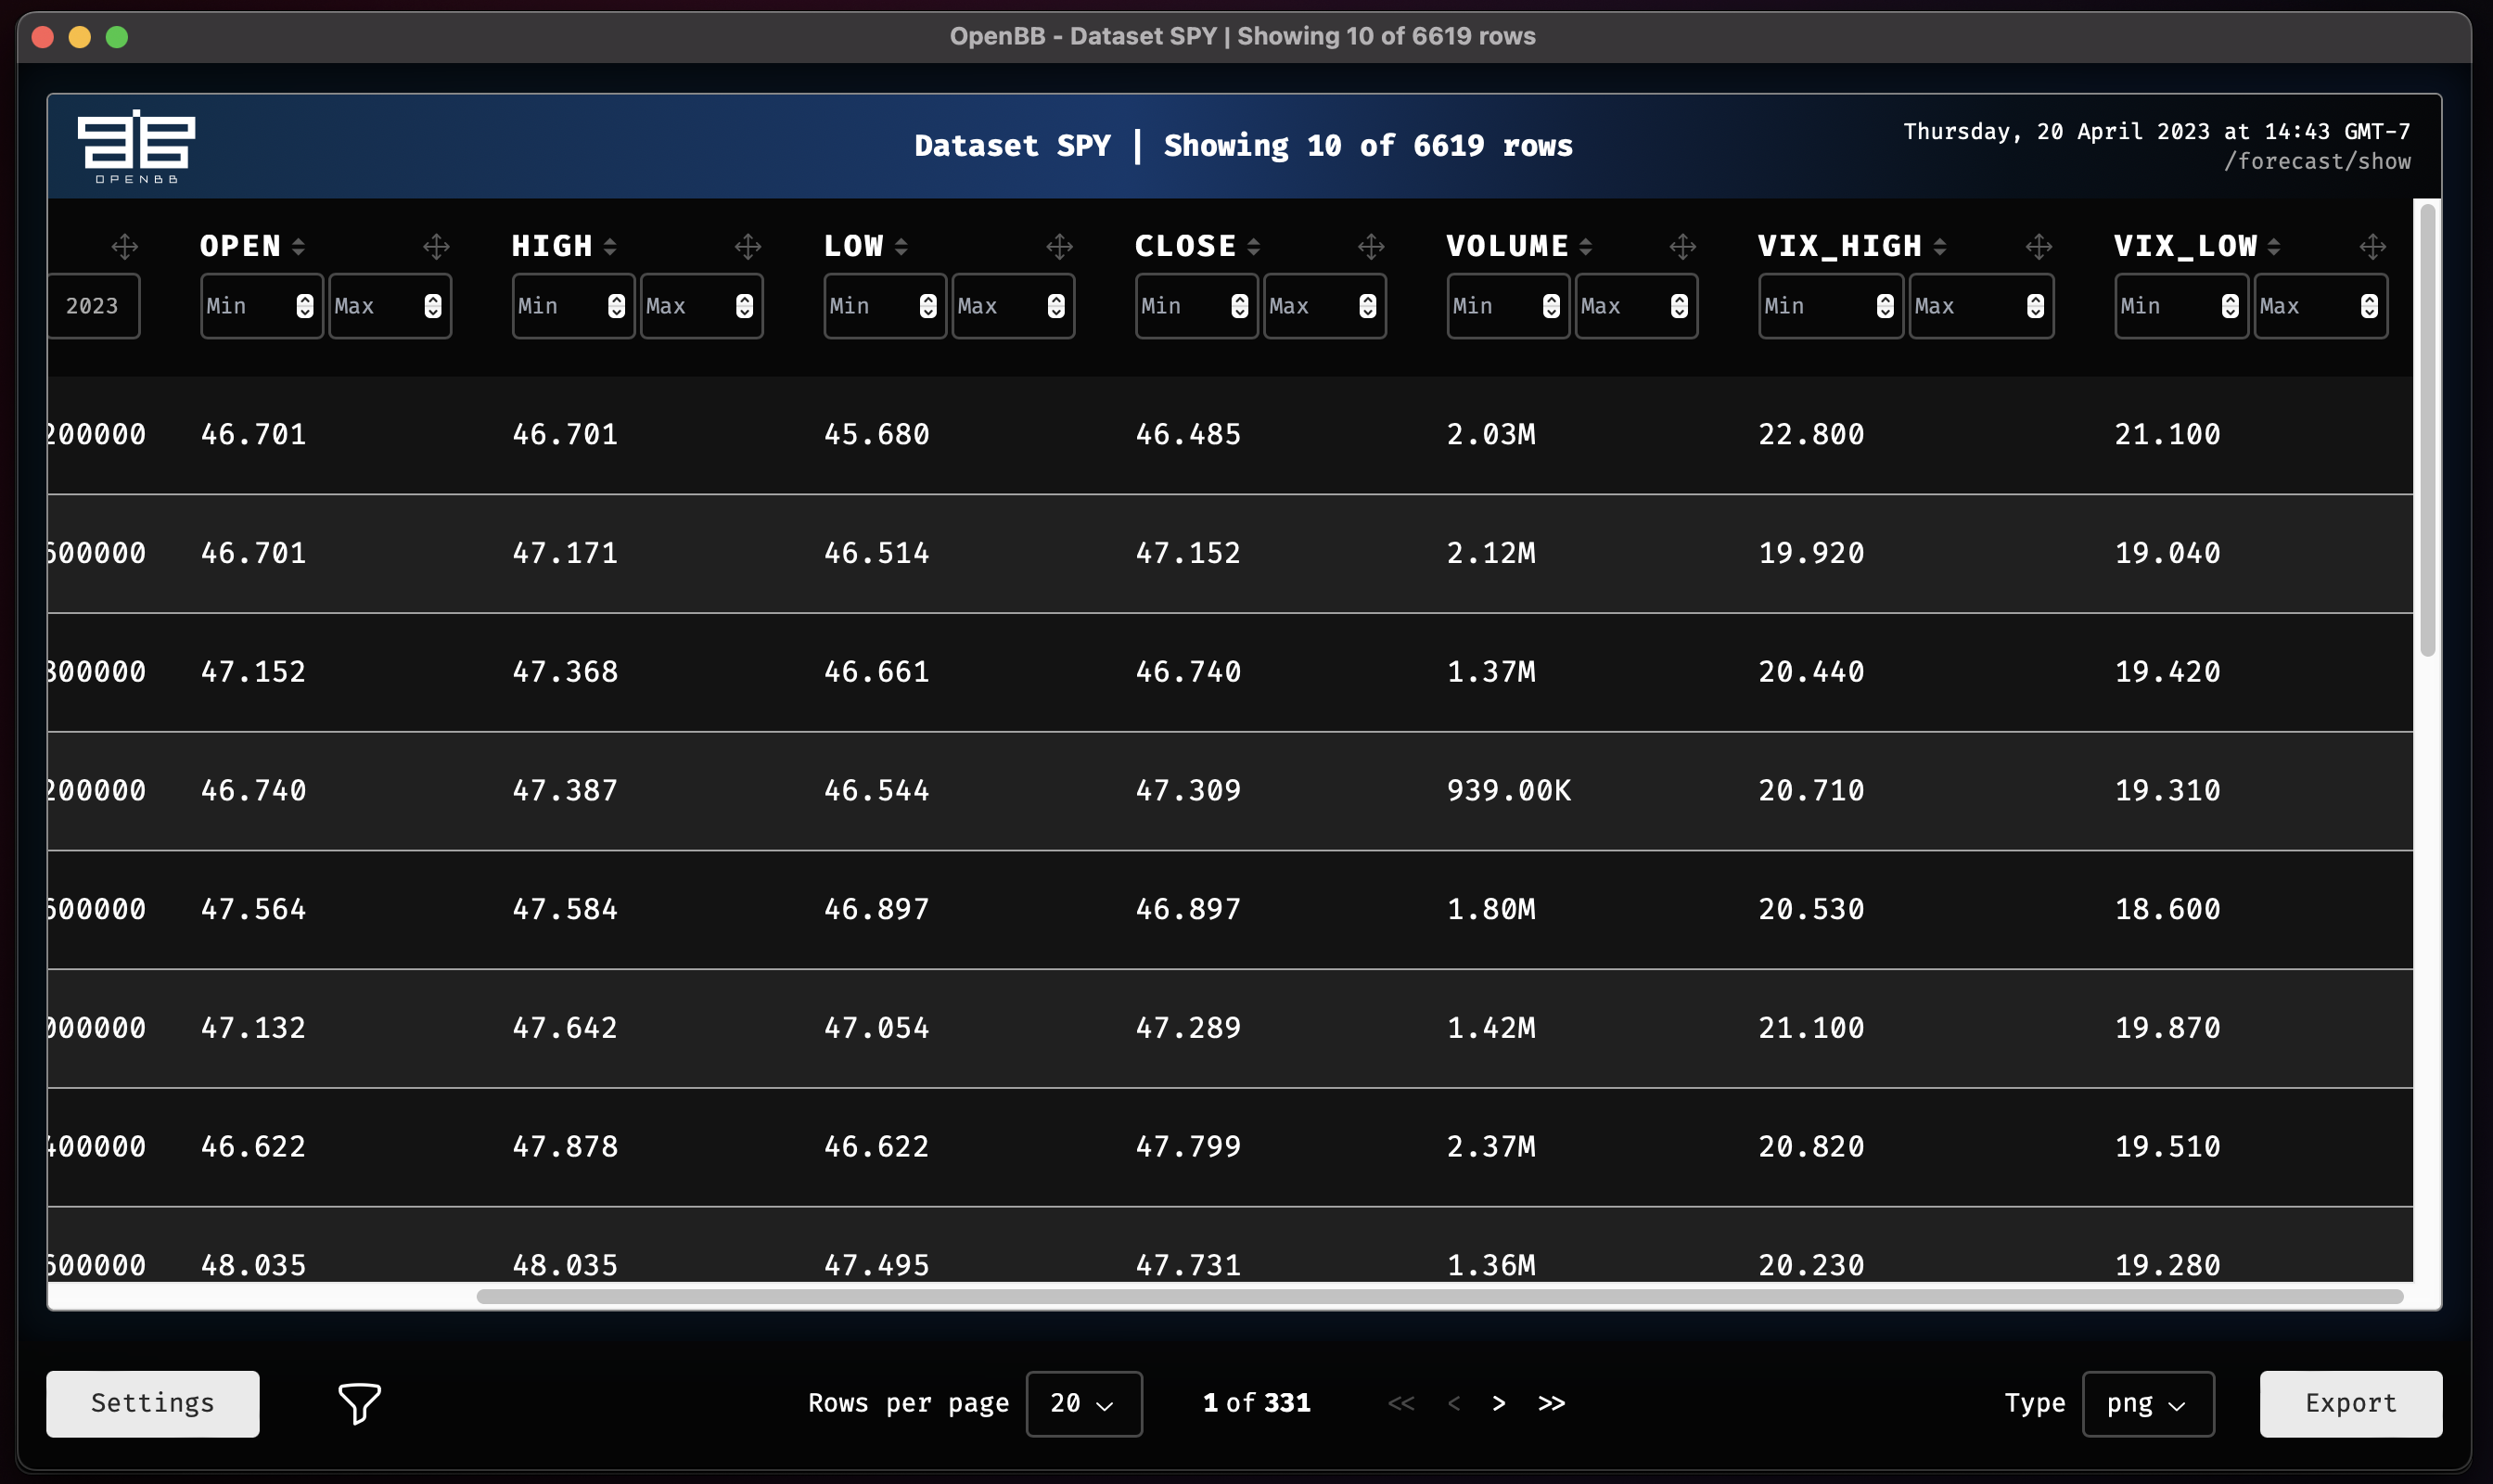
The SPY time series now has two additional columns from the VIX dataframe, high and low.
|
|
|
|
#### Delete
|
|
|
|
It may be desirable to remove entire columns from the target dataset. The syntax below removes the three columns from the SPY data loaded through the stocks menu.
|
|
|
|
```console
|
|
delete --delete SPY.adj_close
|
|
delete --delete SPY.stock_splits
|
|
delete --delete SPY.dividends
|
|
```
|
|
|
|
#### Show
|
|
|
|
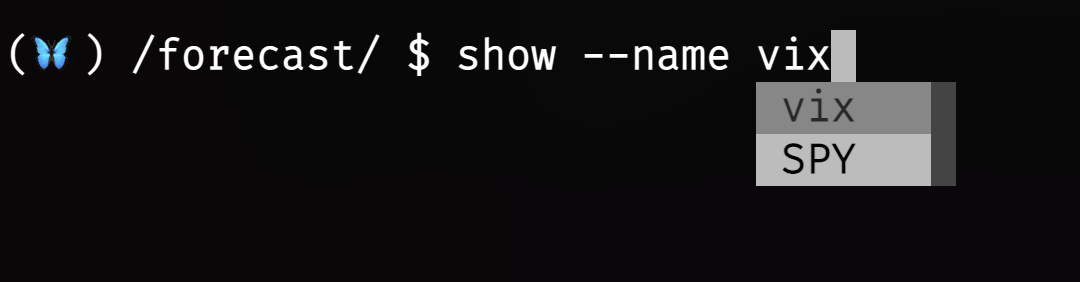
After performing operations, examine the results using the `show` command.
|
|
|
|
|
|
|
|
```console
|
|
show --name SPY
|
|
```
|
|
|
|
|
|
|
|
#### Export
|
|
|
|
To save all of the combined changes within a dataset, export it to a new file.
|
|
|
|
```console
|
|
export -d SPY --type csv
|
|
```
|
|
|
|
This creates a new file in the [OpenBBUserData folder](/terminal/usage/data/custom-data).
|
|
|
|
### Feature Engineering
|
|
|
|
The Feature Engineering section provides methods for making fast calculations with a dataset. Each one is listed below with a short description.
|
|
|
|
|Function |Description |
|
|
|:--------|-----------:|
|
|
|atr |Add Average True Range |
|
|
|delta |Add % Change |
|
|
|ema |Add Exponentially Weighted Moving Average |
|
|
|mom |Add Momentum |
|
|
|roc |Add Rate of Change |
|
|
|rsi |Add Relative Strength Index |
|
|
|sto |Add Stochastic Oscillator %K and %D |
|
|
|signal |Add Price Signal (short vs. long term) |
|
|
|
|
Each function will have slight variations to the command syntax, but will generally operate similarly. Print the help dialogue as a reminder.
|
|
|
|
```console
|
|
usage: rsi [-d {vix,SPY}] [-c TARGET_COLUMN] [--period PERIOD] [-h]
|
|
|
|
Add rsi to dataset based on specific column.
|
|
|
|
options:
|
|
-d {vix,SPY}, --dataset {vix,SPY}
|
|
The name of the dataset you want to select (default: None)
|
|
-c TARGET_COLUMN, --target-column TARGET_COLUMN
|
|
The name of the specific column you want to use (default: close)
|
|
--period PERIOD The period to use (default: 10)
|
|
-h, --help show this help message (default: False)
|
|
|
|
|
|
For more information and examples, use 'about rsi' to access the related guide.
|
|
```
|
|
|
|
```console
|
|
|
|
usage: atr [--close-col CLOSE_COL] [--high-col HIGH_COL] [--low-col LOW_COL] [-d {vix,SPY}]
|
|
[-c TARGET_COLUMN] [-h]
|
|
|
|
Add Average True Range to dataset of specific stock ticker.
|
|
|
|
options:
|
|
--close-col CLOSE_COL
|
|
Close column name to use for Average True Range. (default: close)
|
|
--high-col HIGH_COL High column name to use for Average True Range. (default: high)
|
|
--low-col LOW_COL Low column name to use for Average True Range. (default: low)
|
|
-d {vix,SPY}, --dataset {vix,SPY}
|
|
The name of the dataset you want to select (default: None)
|
|
-c TARGET_COLUMN, --target-column TARGET_COLUMN
|
|
The name of the specific column you want to use (default: close)
|
|
-h, --help show this help message (default: False)
|
|
|
|
For more information and examples, use 'about atr' to access the related guide.
|
|
```
|
|
|
|
To use these commands with the default settings, apply the syntax below.
|
|
|
|
```console
|
|
atr -d SPY
|
|
rsi -d SPY
|
|
```
|
|
|
|
There are now two new columns in the SPY dataset, `true_range, RSI_10_close`. To keep the dataset organized, it may be worth renaming these columns.
|
|
|
|
```console
|
|
rename -d SPY --oldcol RSI_10_close --newcol spy_rsi10
|
|
rename -d SPY --oldcol true_range --newcol spy_atr
|
|
```
|
|
|
|
### Time Series Forecasting
|
|
|
|
This group of features applies models to a target dataset and its columns. There are a wide selection to choose from. Please note that this guide is meant explain how to use the functions and does not attempt to explain the models themselves. This menu is an implementation of the [Unit8 Darts Time Series for Python](https://unit8.com/resources/darts-time-series-made-easy-in-python/) library.
|
|
|
|
|Function |Description |Accepts Past Covariates? |
|
|
|:--------|:------------|:-----------------------|
|
|
|autoselect |Select best statistical model from AutoARIMA, AutoETS, AutoCES, MSTL, etc. |No |
|
|
|autoarima |Automatic ARIMA Model |No |
|
|
|autoces |Automatic Complex Exponential Smoothing Model |No |
|
|
|autoets |Automatic ETS (Error, Trend, Seasonality) Model |No |
|
|
|mstl |Multiple Seasonalities and Trend using Loess (MSTL) Model |No |
|
|
|rwd |Random Walk with Drift Model |No |
|
|
|seasonalnaive |Seasonal Naive Model |No |
|
|
|expo |Probabilistic Exponential Smoothing |No |
|
|
|theta |Theta Method |No |
|
|
|linregr |Probabilistic Linear Regression |Yes |
|
|
|regr |Regression |Yes |
|
|
|brnn |Block Recurrent Neural Network (RNN, LSTM, GRU) |Yes |
|
|
|nbeats |Neural Bayesian Estimation |Yes |
|
|
|nhits |Neural Hierarchical Interpolation |Yes |
|
|
|tcn |Temporal Convolutional Neural Network |Yes |
|
|
|trans |Transformer Network |Yes |
|
|
|tft |Temporal Fusion Transformer Network |Yes |
|
|
|
|
Within this list of models, there are two distinct categories:
|
|
|
|
- Without past covariates.
|
|
- With past covariates.
|
|
|
|
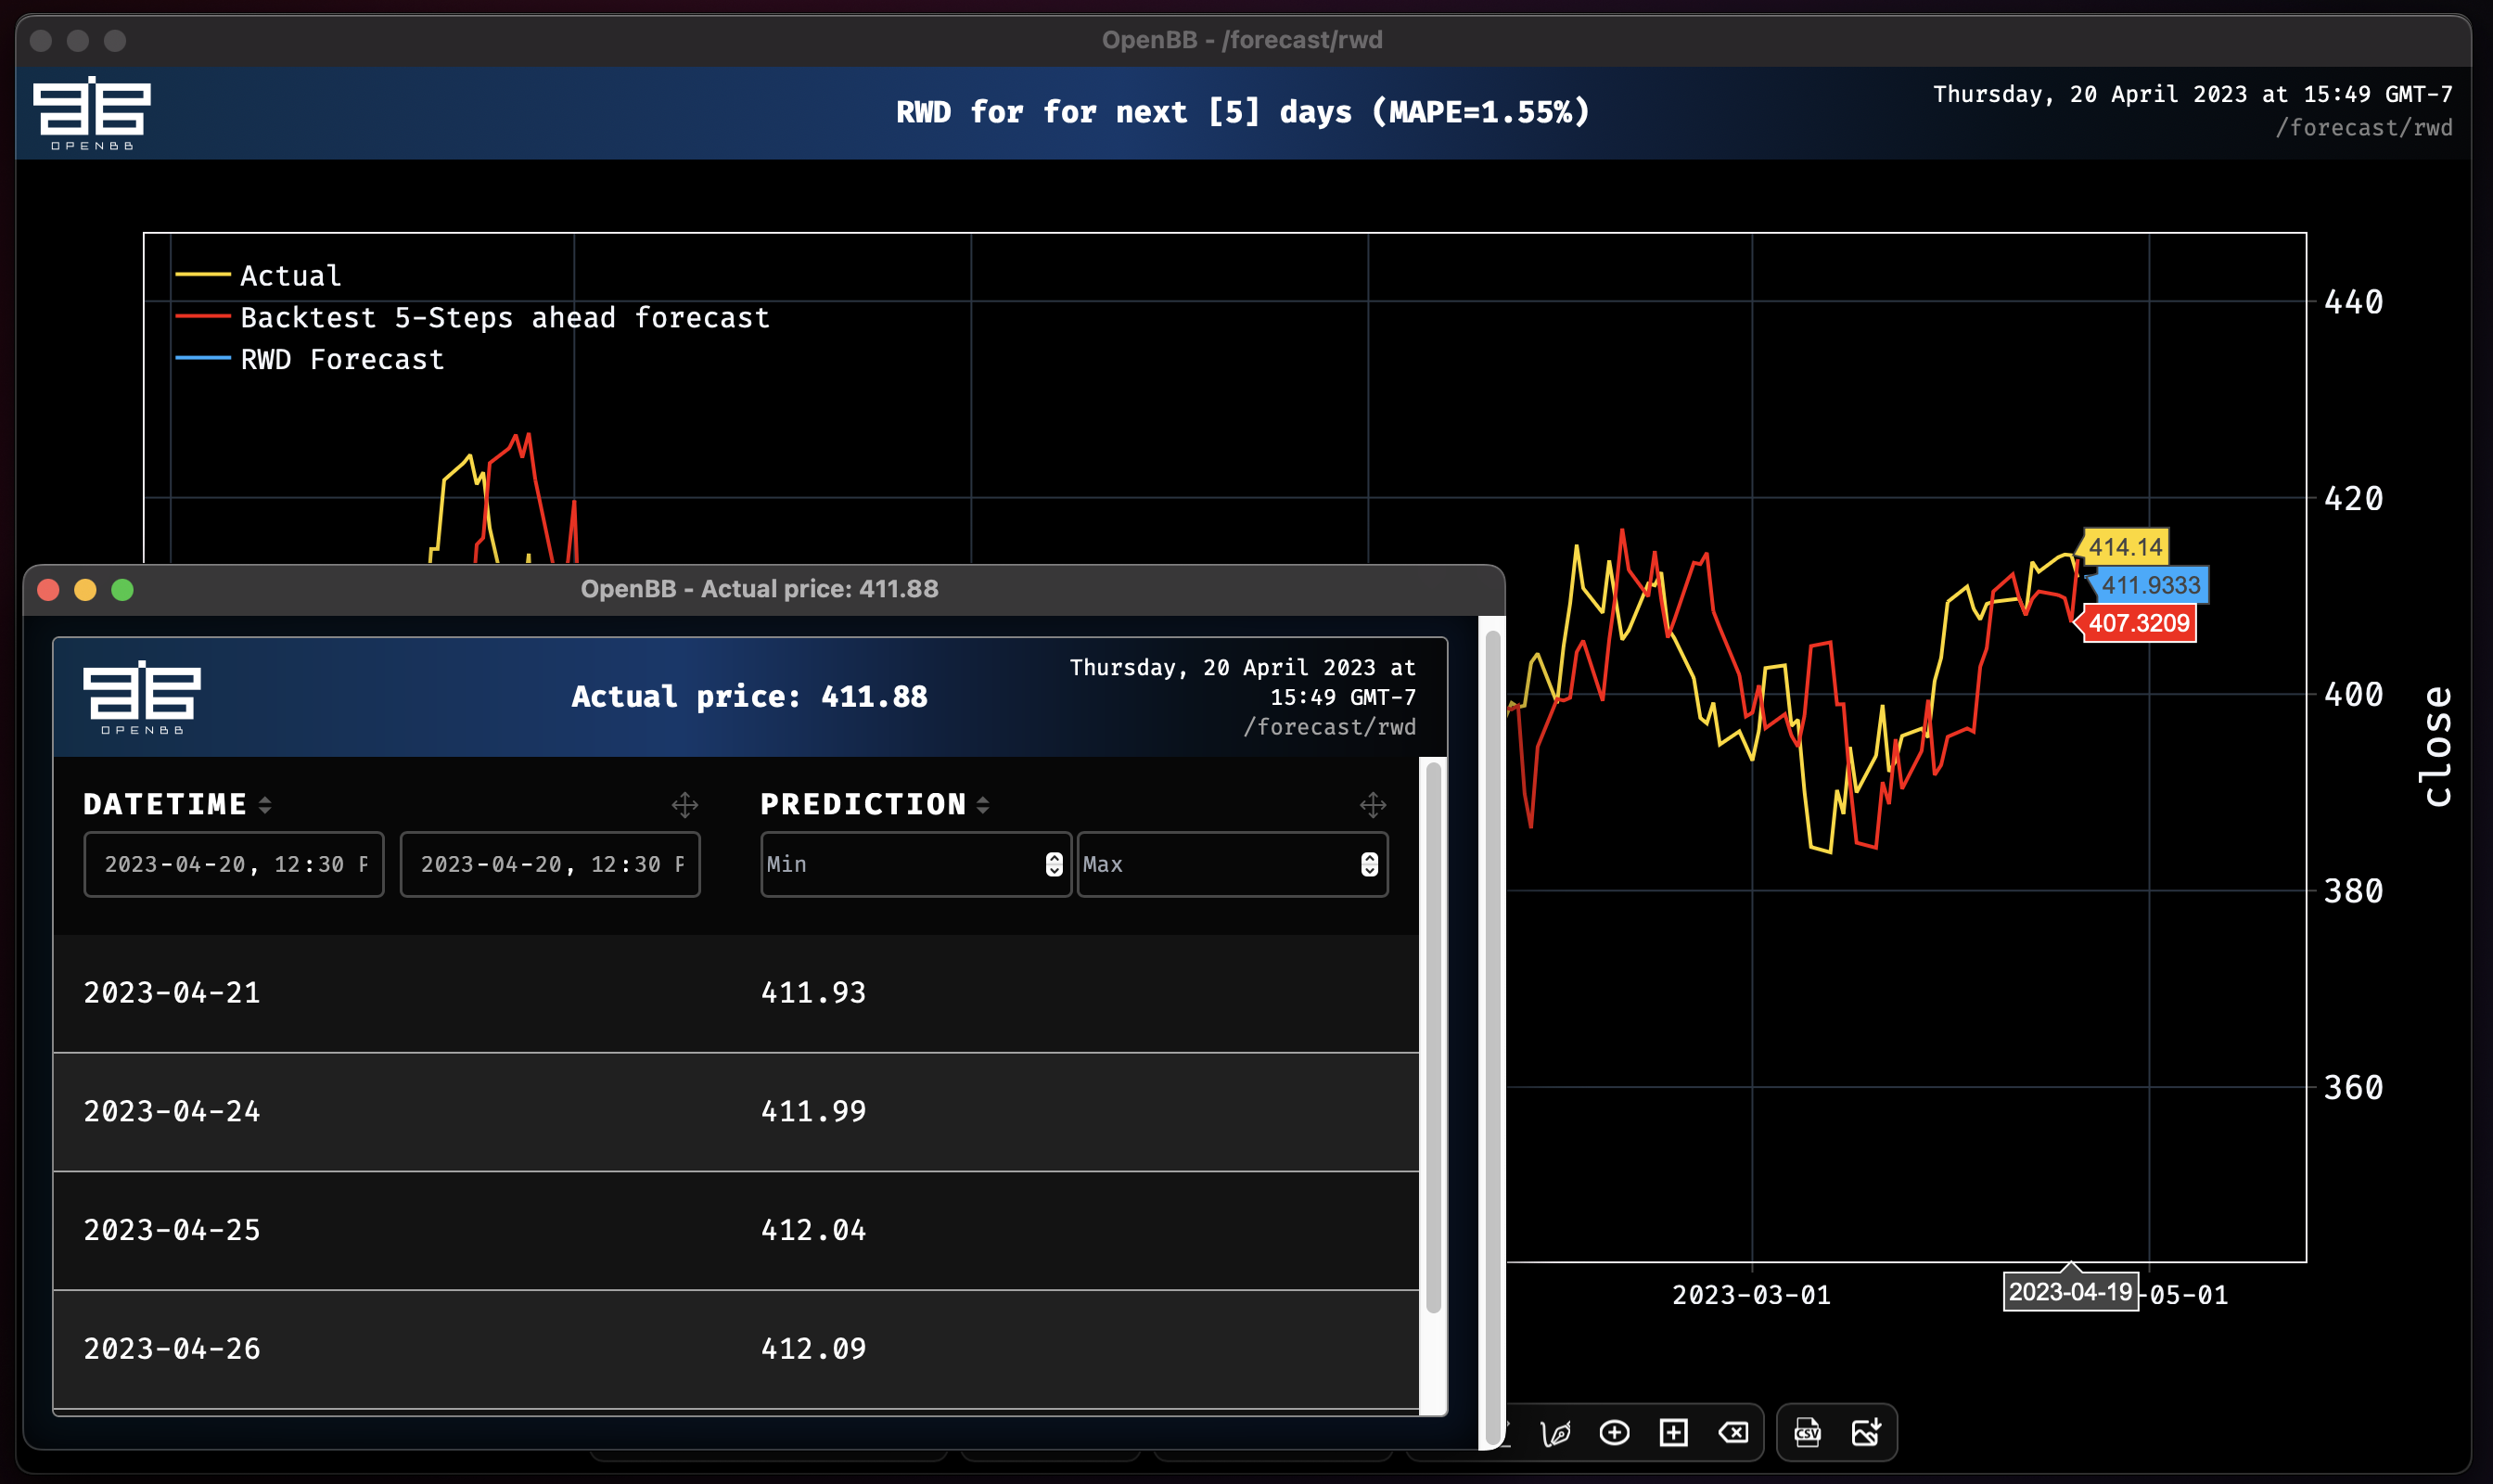
The models featuring past covariates will accept an unlimited number of columns, or all columns can be chosen. The latter being more appropriate for when a dataset contains only columns which are deemed fit for the purpose. To use any model in its default state, all that is required is the command name and the target dataset's name. The default target column will always be `close` so, a column must be defined to run a model if the target dataset does not contain a column with this name. With the target column as `close`, the basic default syntax will look like:
|
|
|
|
```console
|
|
rwd -d SPY
|
|
```
|
|
|
|
|
|
|
|
Each model should be reviewed carefully to understand what the adjustable parameters are, and how they should be defined.
|
|
|
|
### Quantile Anomaly Detection
|
|
|
|
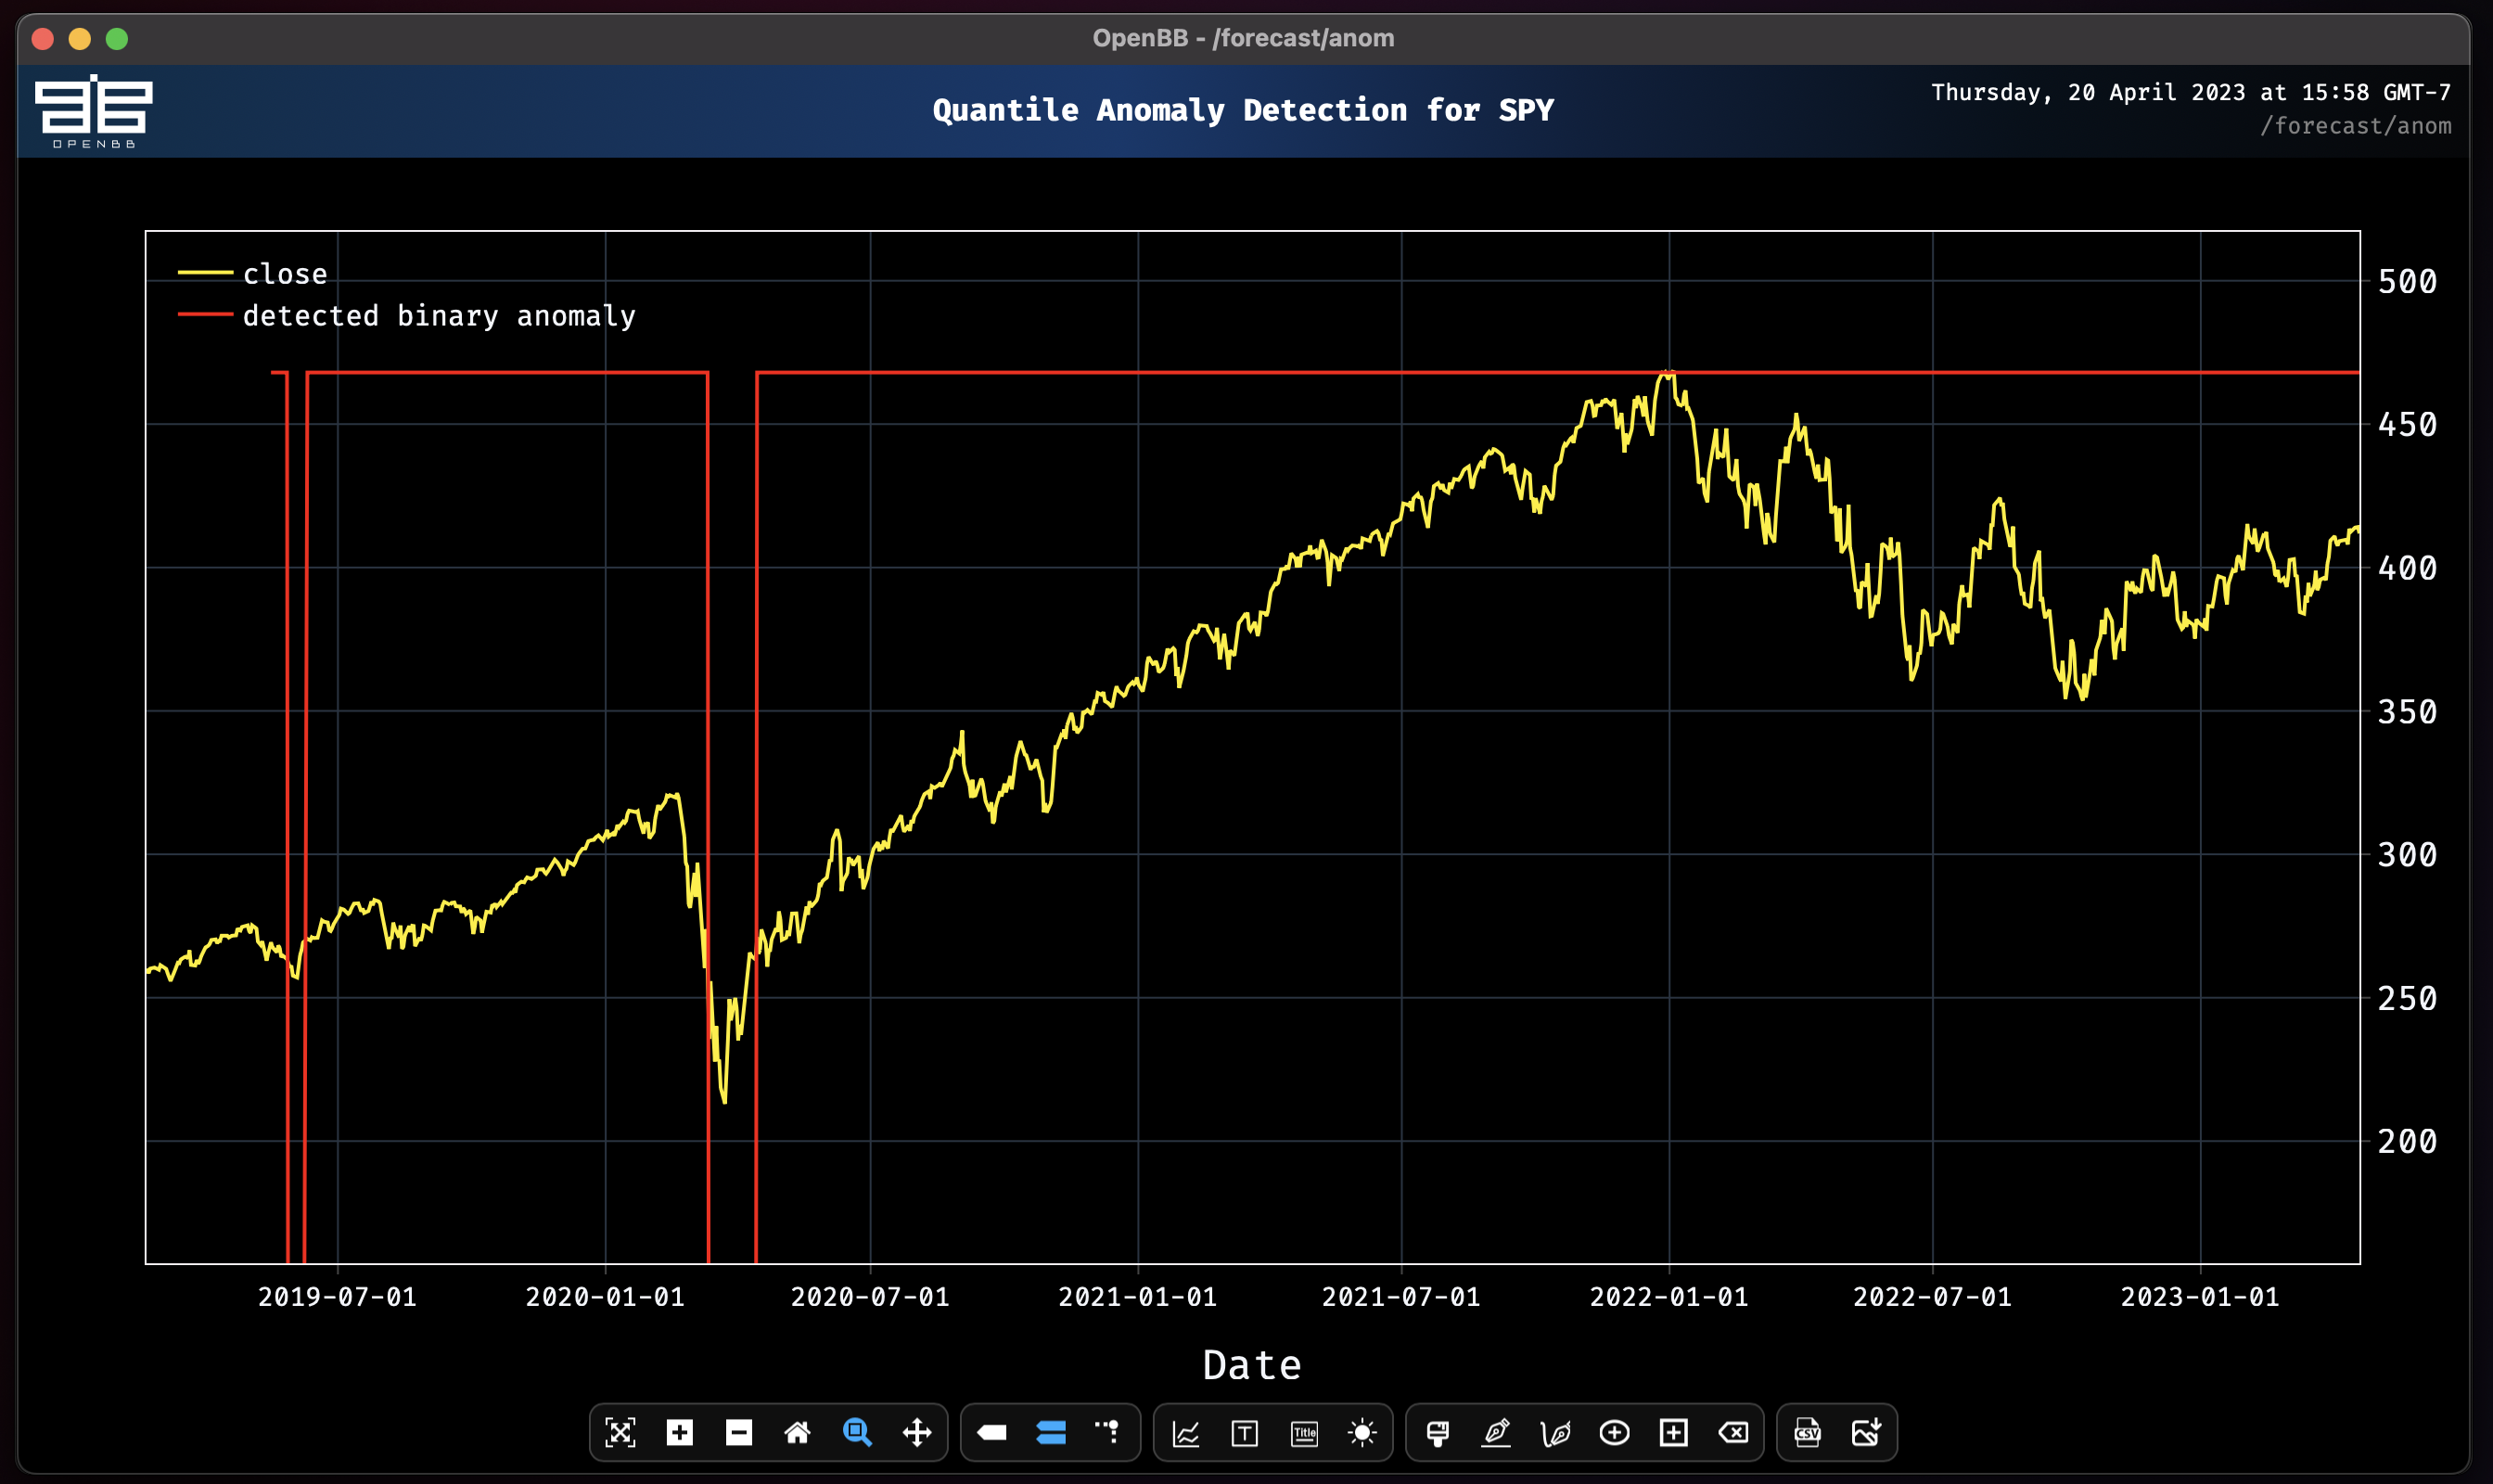
`anom` performs a Quantile Anomaly detection on a given dataset. Read more about this calculation [here](https://unit8co.github.io/darts/generated_api/darts.ad.detectors.quantile_detector.html).
|
|
|
|
```console
|
|
anom -d SPY
|
|
```
|
|
|
|
|
|
|
|
### Miscellaneous AI Tools
|
|
|
|
#### Whisper
|
|
|
|
The `whisper` feature allows users to transcribe, translate, and summarize videos on YouTube. These abilities empowers users to perform deeper research than ever before, and opens the door to a more complete view of the macroeconomic landscape. The models are not installed until the first time it is used, and they can be quite significant in size. Performance will vary, and there is currently not a method for offloading processing to dedicated GPUs.
|
|
|
|
```console
|
|
whisper https://www.youtube.com/watch?v=G0Q0BtGQzrA
|
|
|
|
[DISCLAIMER]: This is a beta feature that uses standard NLP models. More recent models such as GPT will be added in future releases.
|
|
|
|
Downloading and Loading NLP Pipelines from cache...
|
|
|
|
All NLP Pipelines loaded.
|
|
|
|
Transcribing and summarizing...
|
|
Downloaded video "China stuck in 8 trillion dollar debt crisis | GyanJaraHatke with Sourabh Maheshwari". Generating subtitles...
|
|
Detected language: Hindi
|
|
100%|████████████████████████████████████████████████████████| 83567/83567 [04:25<00:00, 314.21frames/s]
|
|
100%|███████████████████████████████████████████████████████████████████| 11/11 [02:44<00:00, 14.99s/it]
|
|
|
|
-------------------------
|
|
Summary: Reduction: 81.38%
|
|
Sentiment: NEGATIVE: 73.2596
|
|
-------------------------
|
|
China is the largest economy in the world. Usually China's economy is seen in the global level of the economy of America...
|
|
```
|
|
|
|
A file with the transcript is saved to the OpenBBUserData folder.
|
|
|
|
## Sample Workflow #1 (Beginner)
|
|
|
|
Let's begin by using one of the datasets we loaded in previously : `SPY`
|
|
|
|
We will be forecasting `5 Business days` ahead for the remaider of these workflows unless specified.
|
|
|
|
**Note:** All models automatically perform Historical backtesting on the test split before providing a prediction.
|
|
|
|
We use [MAPE](https://en.wikipedia.org/wiki/Mean_absolute_percentage_error) for the default as it is quite convenient and scale independent since it calculates error as a percentage instead of an absolute value. There are many more metrics to compare time series. The metrics will compare only common slices of series when the two series are not aligned, and parallelize computation over a large number of pairs of series. Additional metrics to choose from are RMSE, MSE, and SMAPE.
|
|
|
|
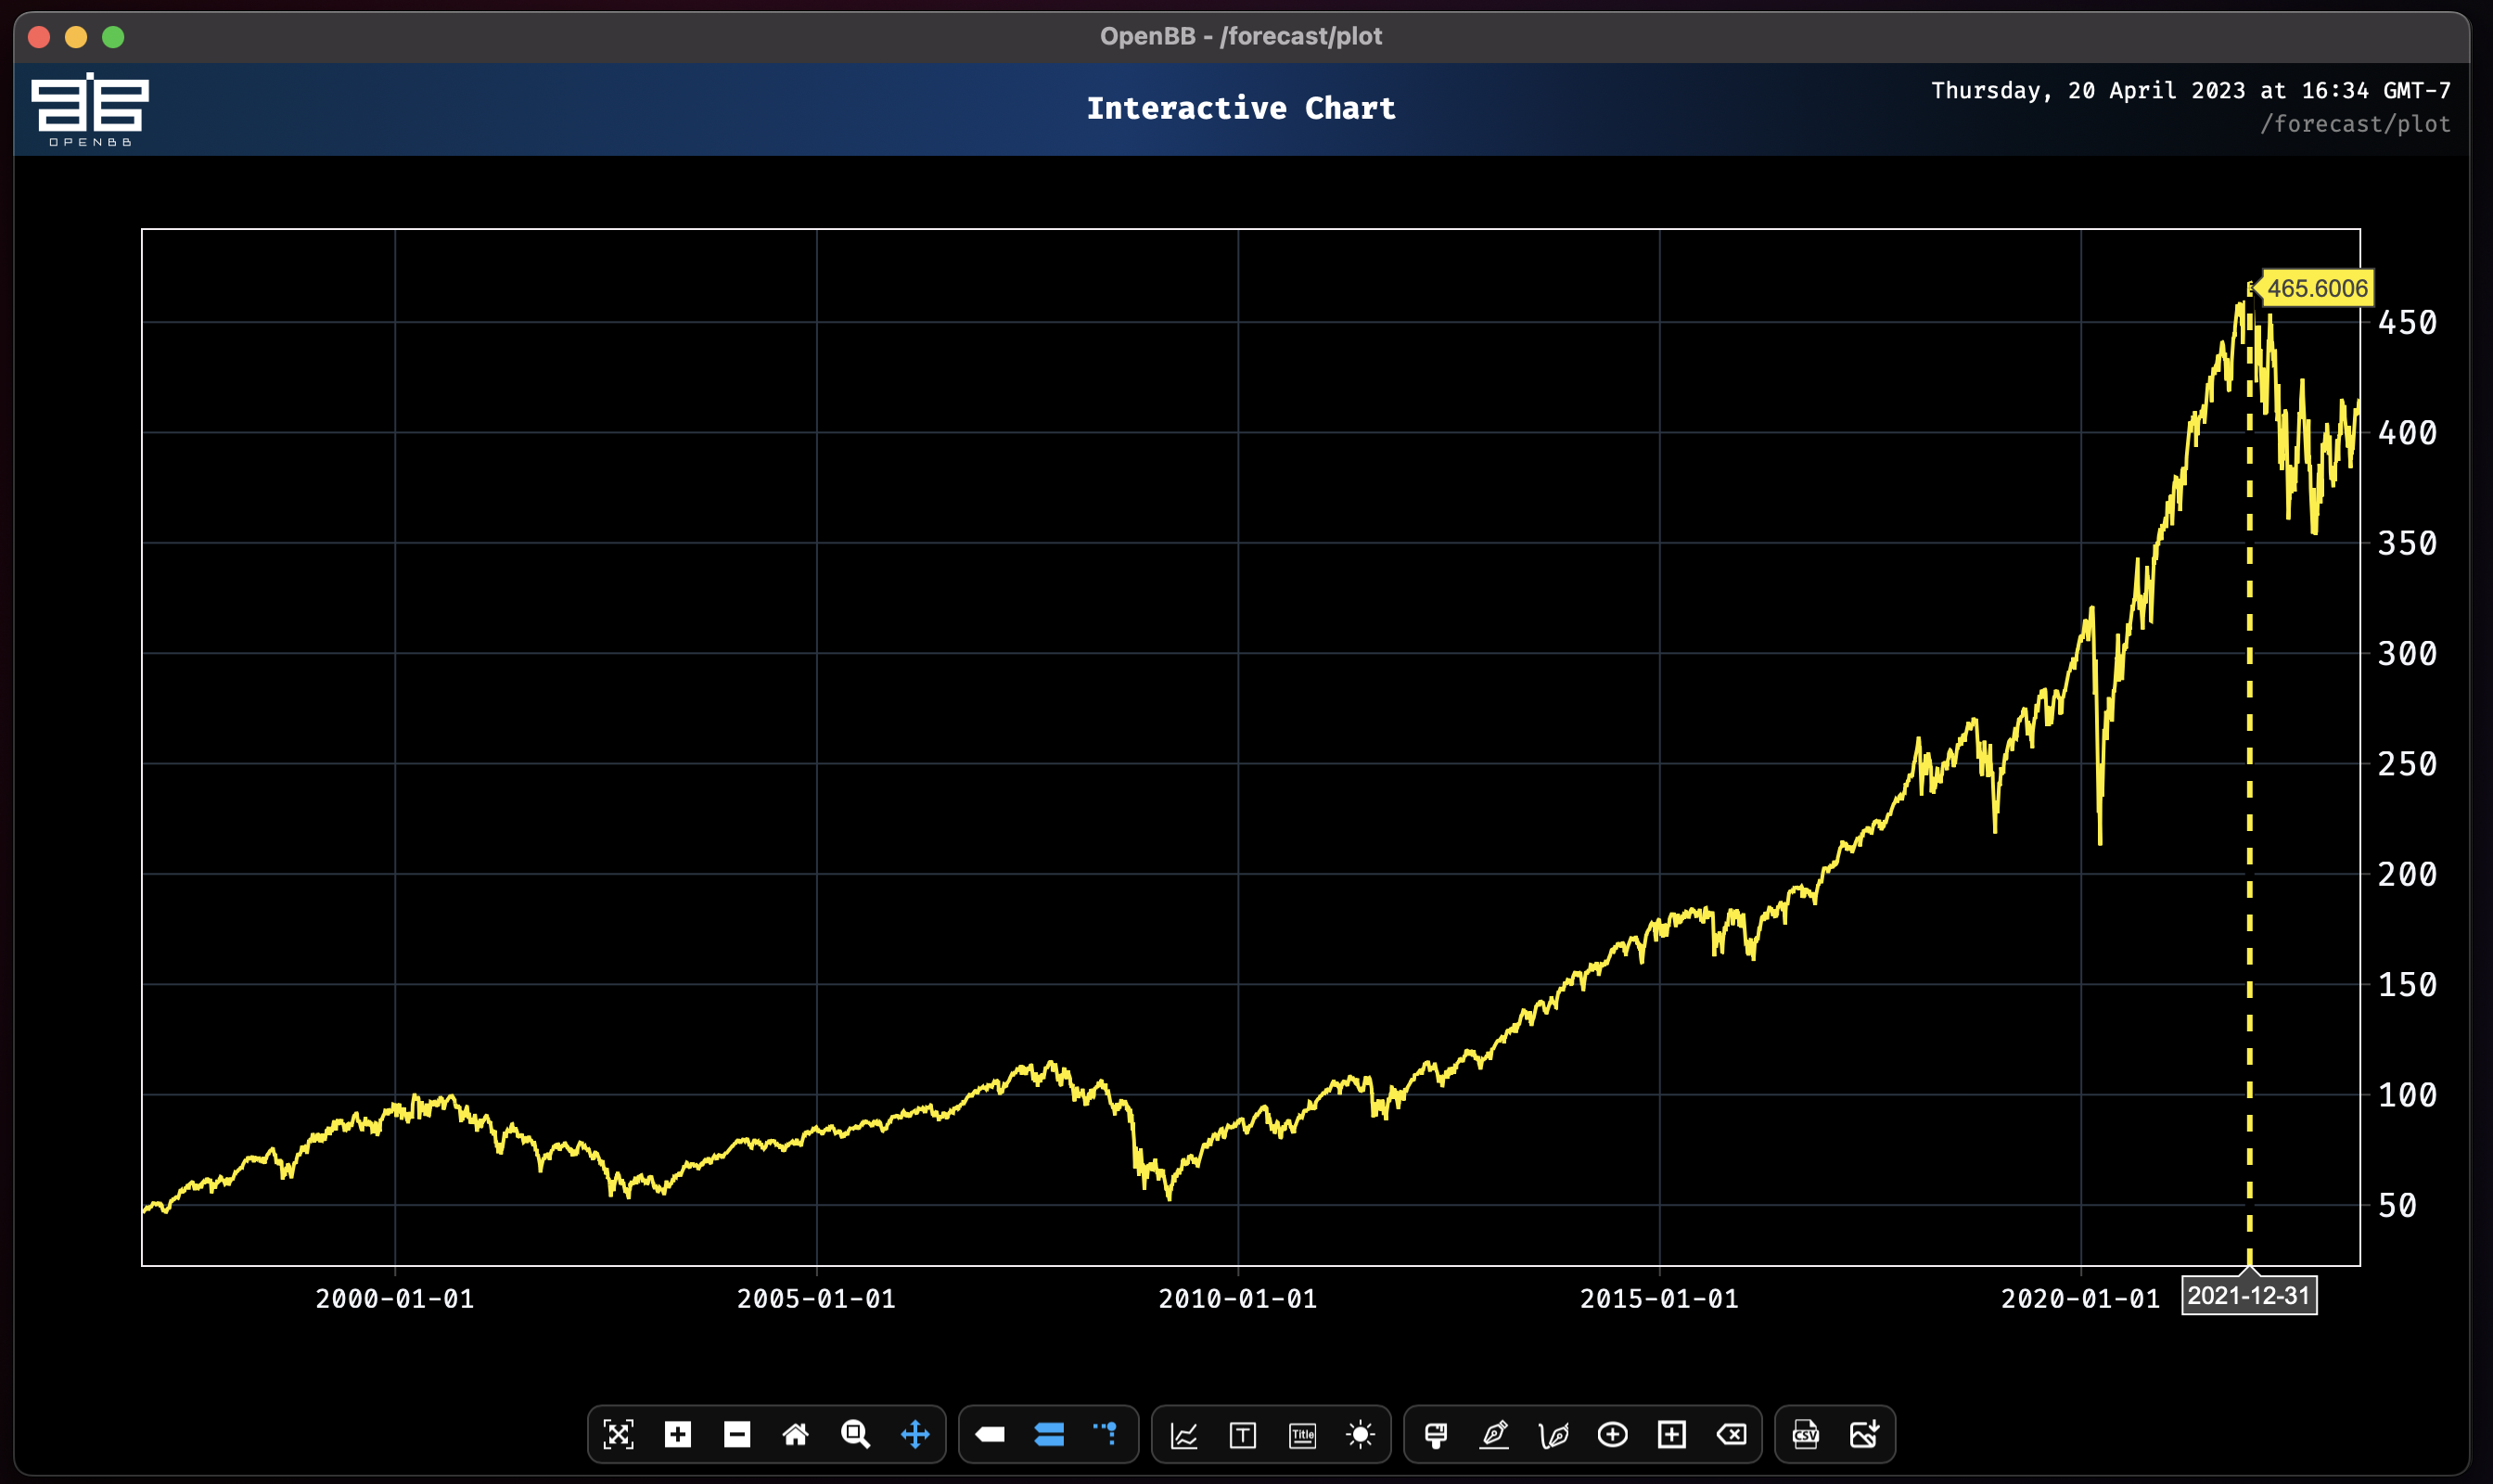
### plot
|
|
|
|
```console
|
|
plot SPY.close
|
|
```
|
|
|
|
|
|
|
|
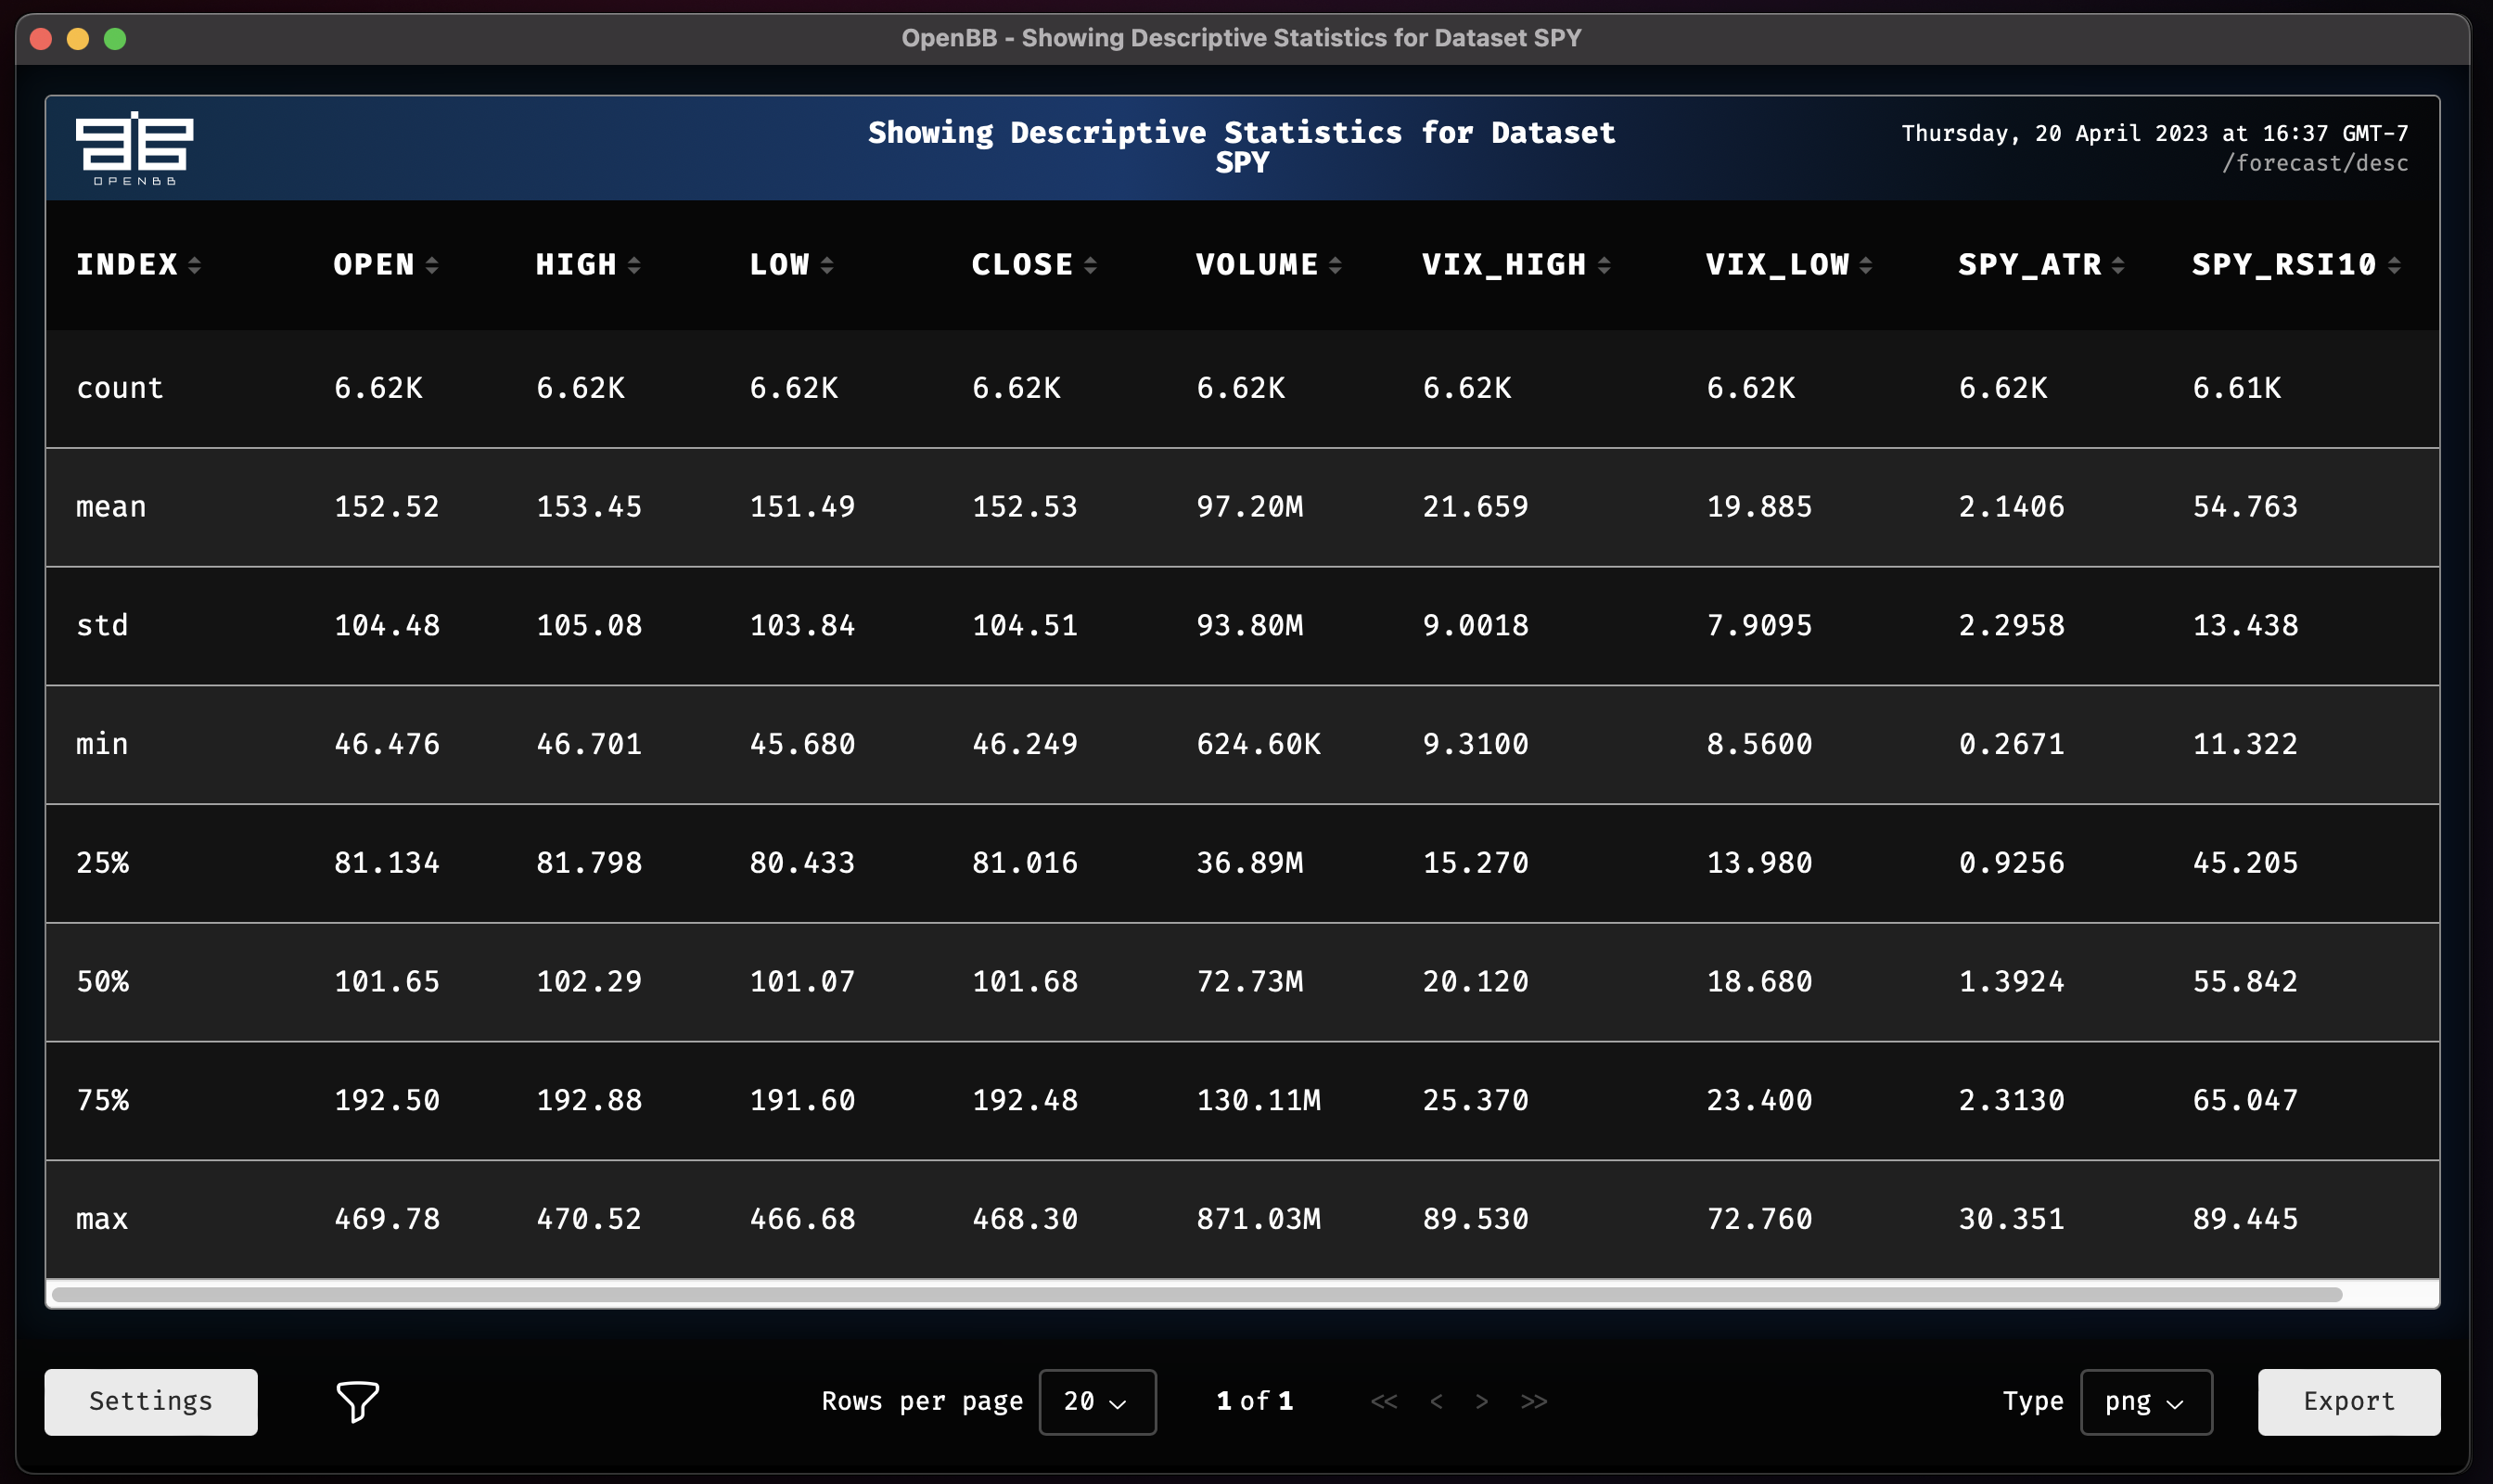
### desc
|
|
|
|
```console
|
|
desc SPY
|
|
```
|
|
|
|
|
|
|
|
### expo
|
|
|
|
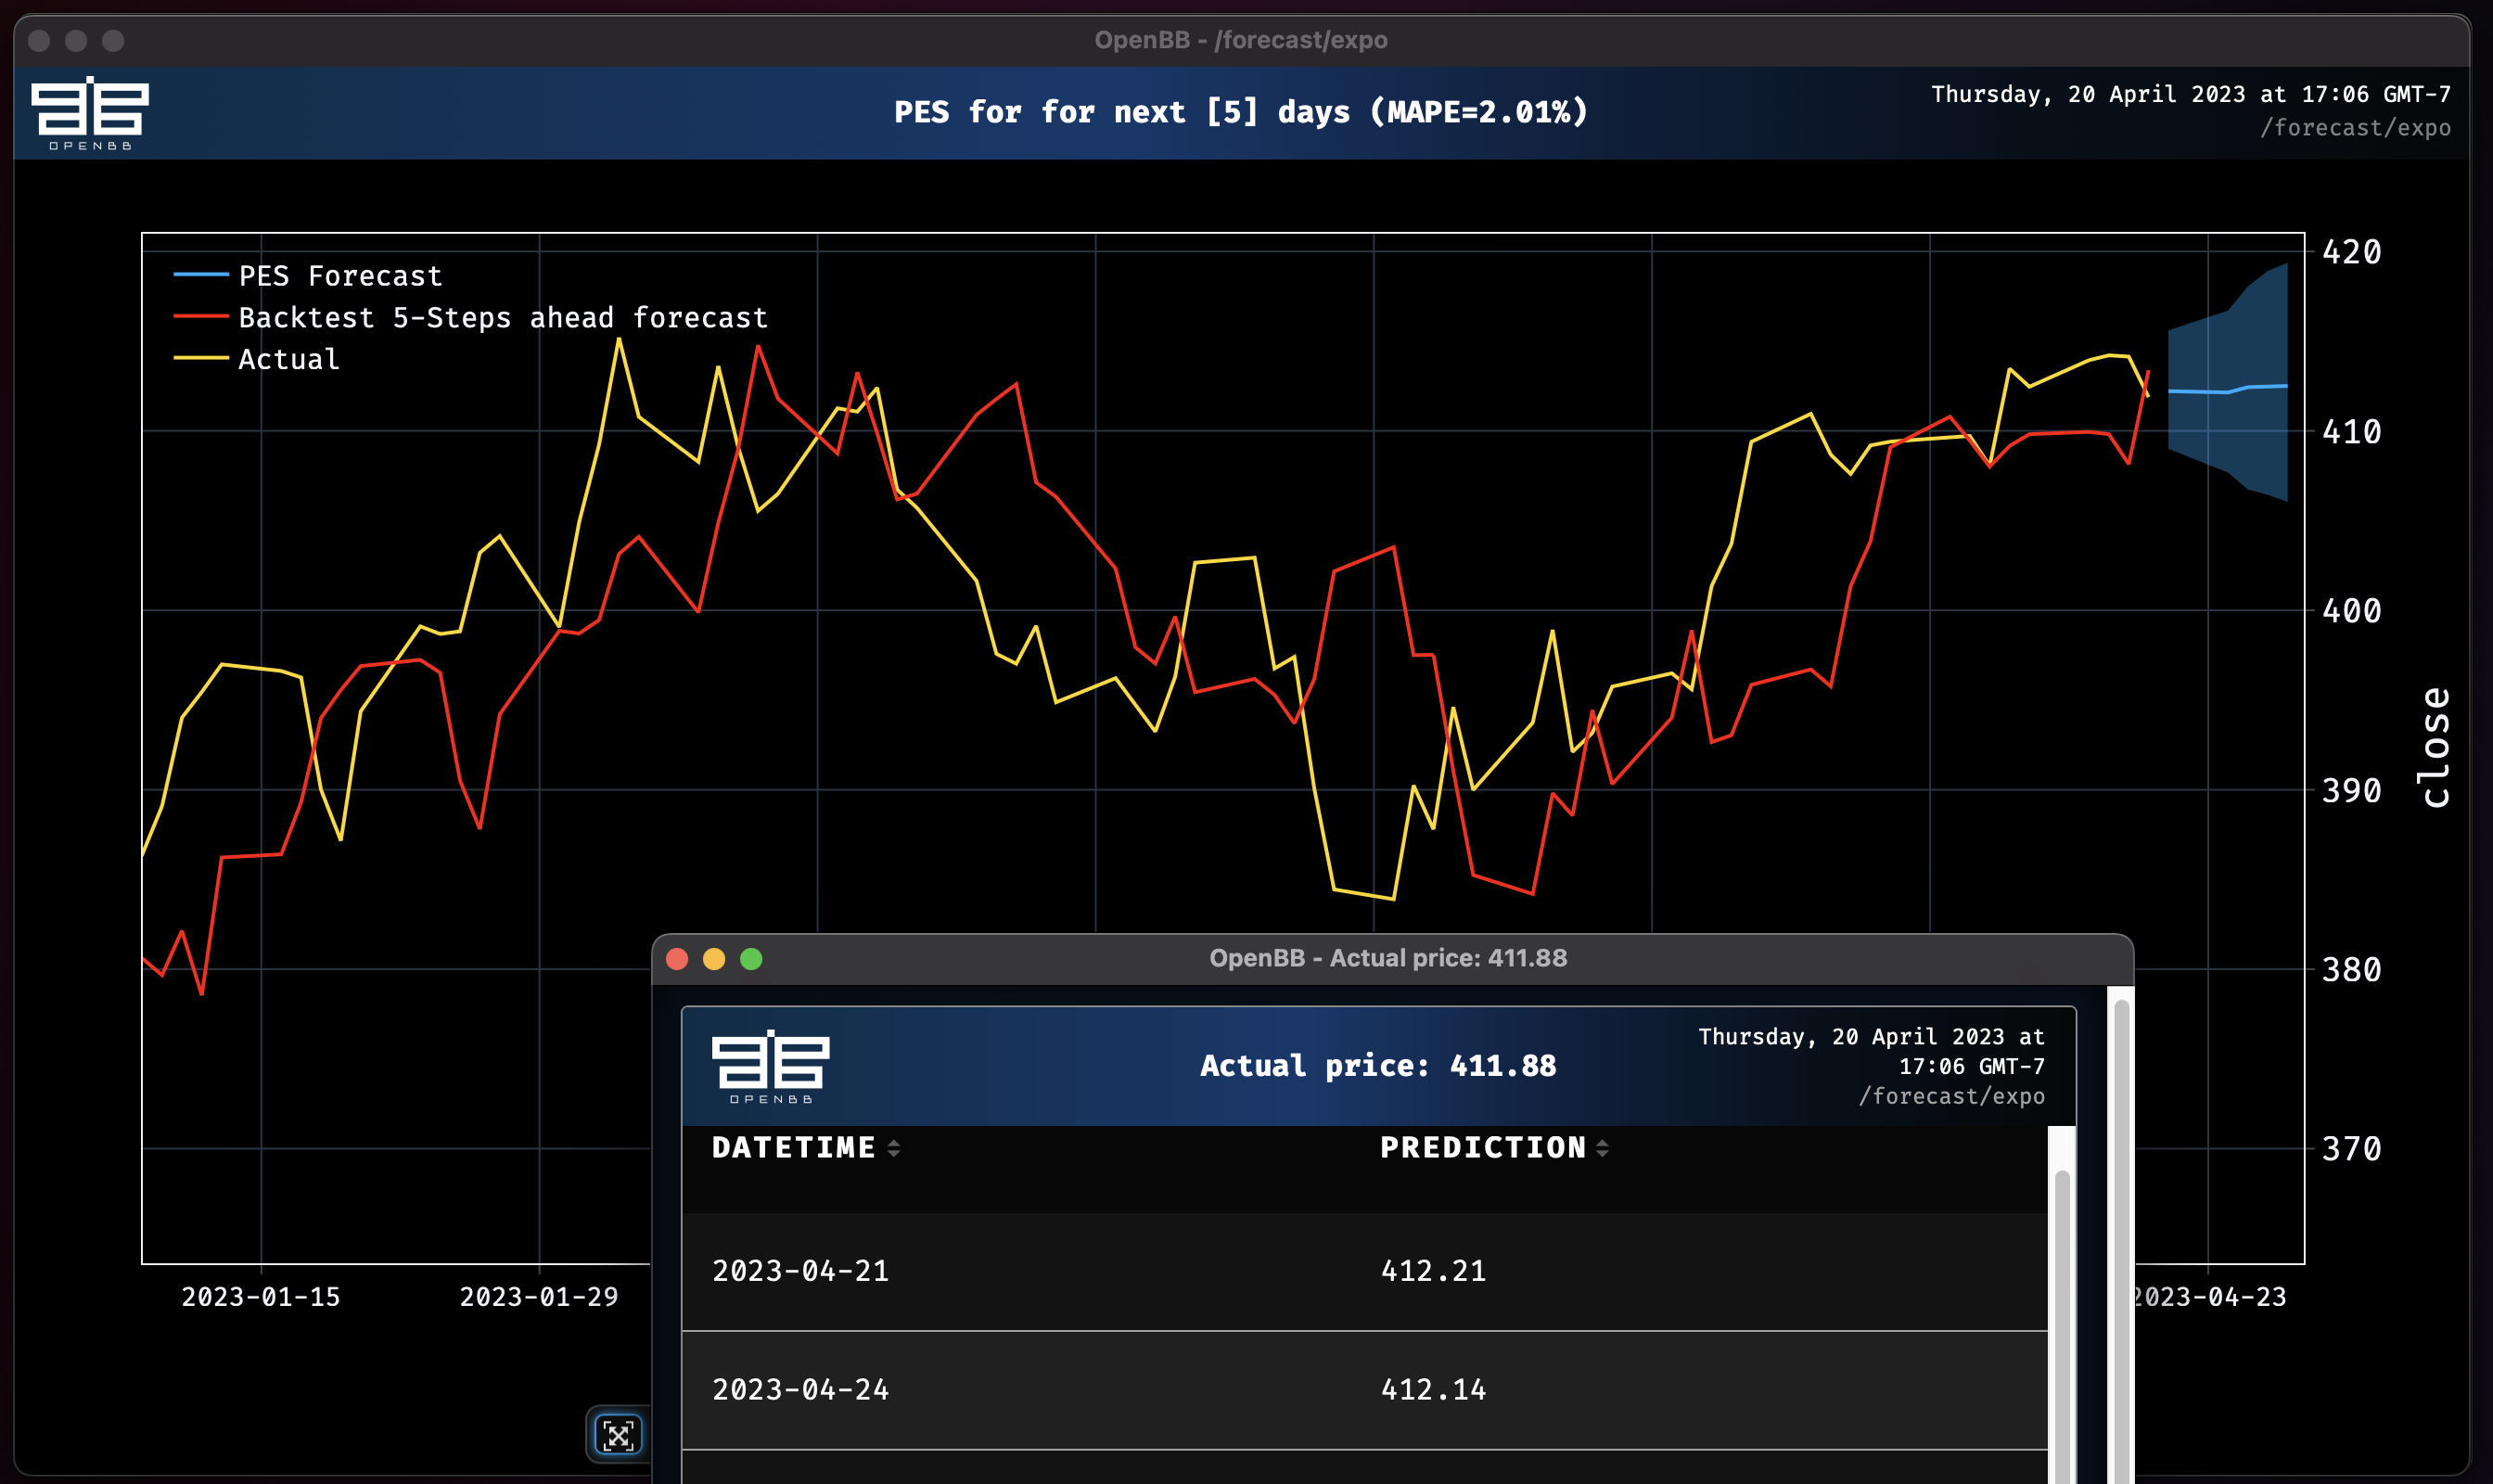
Let's use a simple **Probabilistic Exponential Smoothing Model** to predict the close price. Keep in mind all models are performing automatic historical backtesting before providing future forecasts. Note that all models forecast `close` by default.
|
|
|
|
```console
|
|
expo SPY
|
|
```
|
|
|
|
|
|
|
|
### rnn
|
|
|
|
We can also play with some models that are bit more advanced. As we go down the list, models begin to become larger in parameter size and complexity. This will play a key role later on when we want to train models with `past_covariates` (aka. external factors).
|
|
|
|
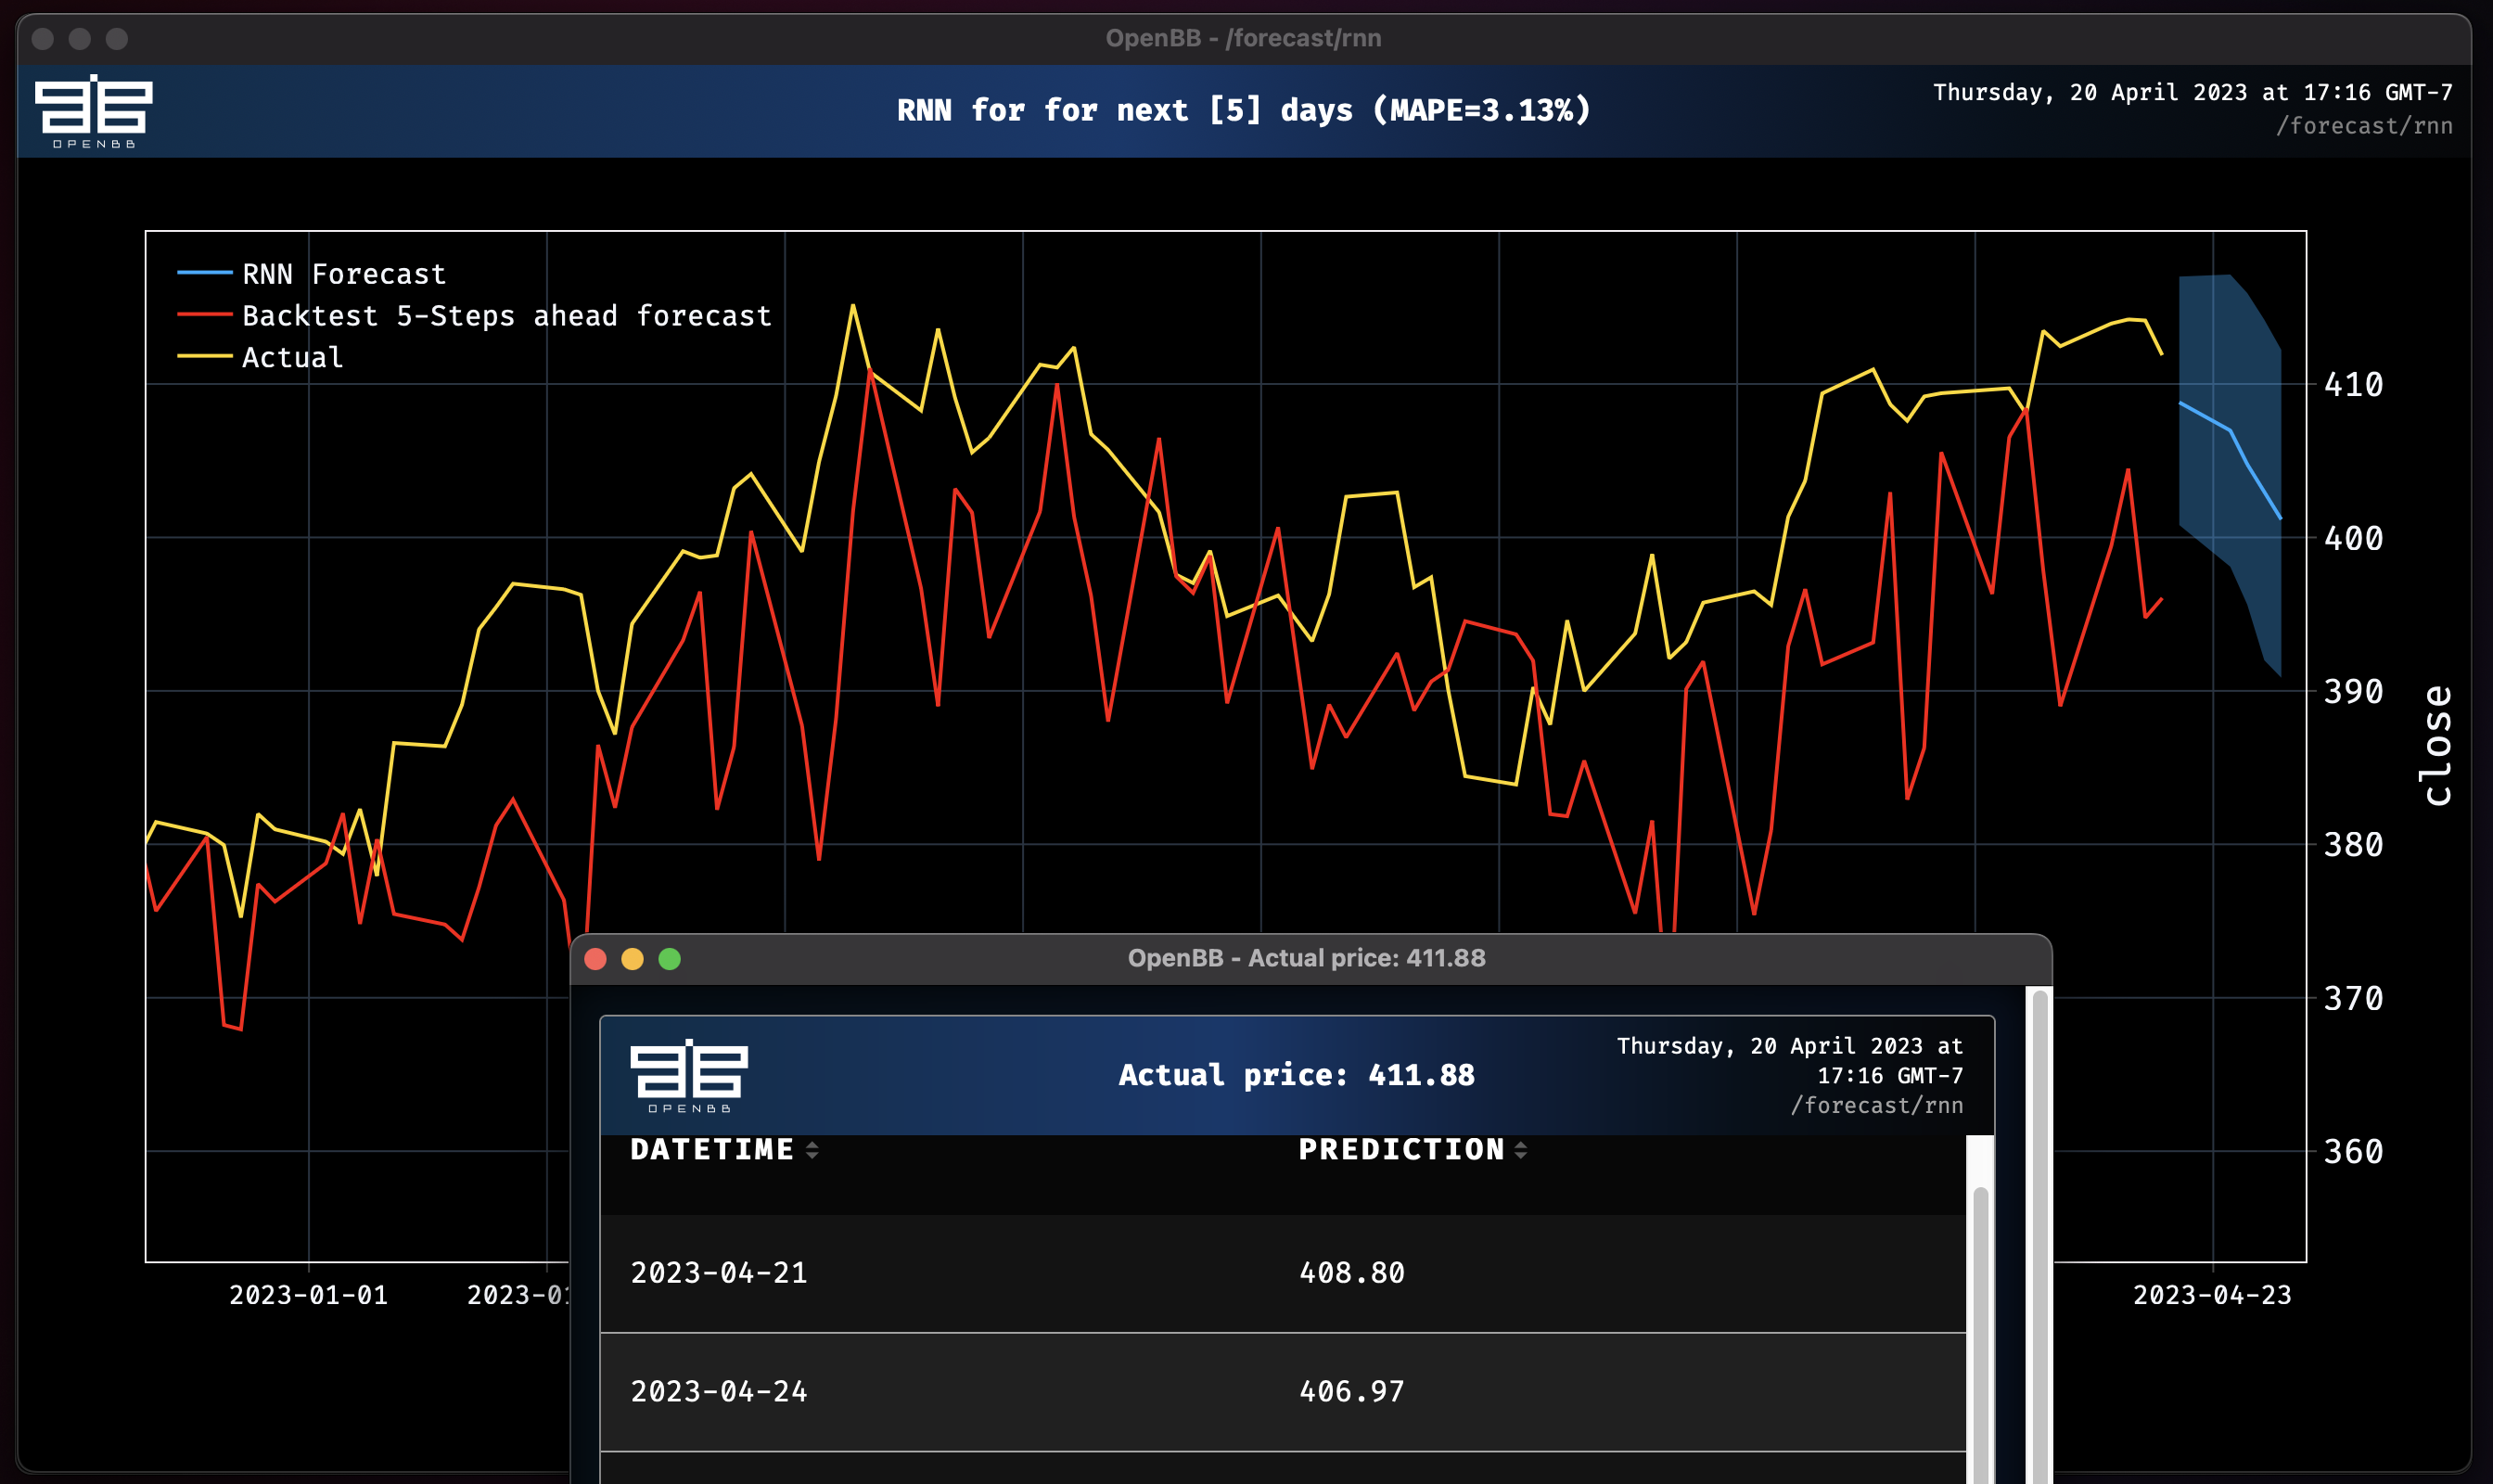
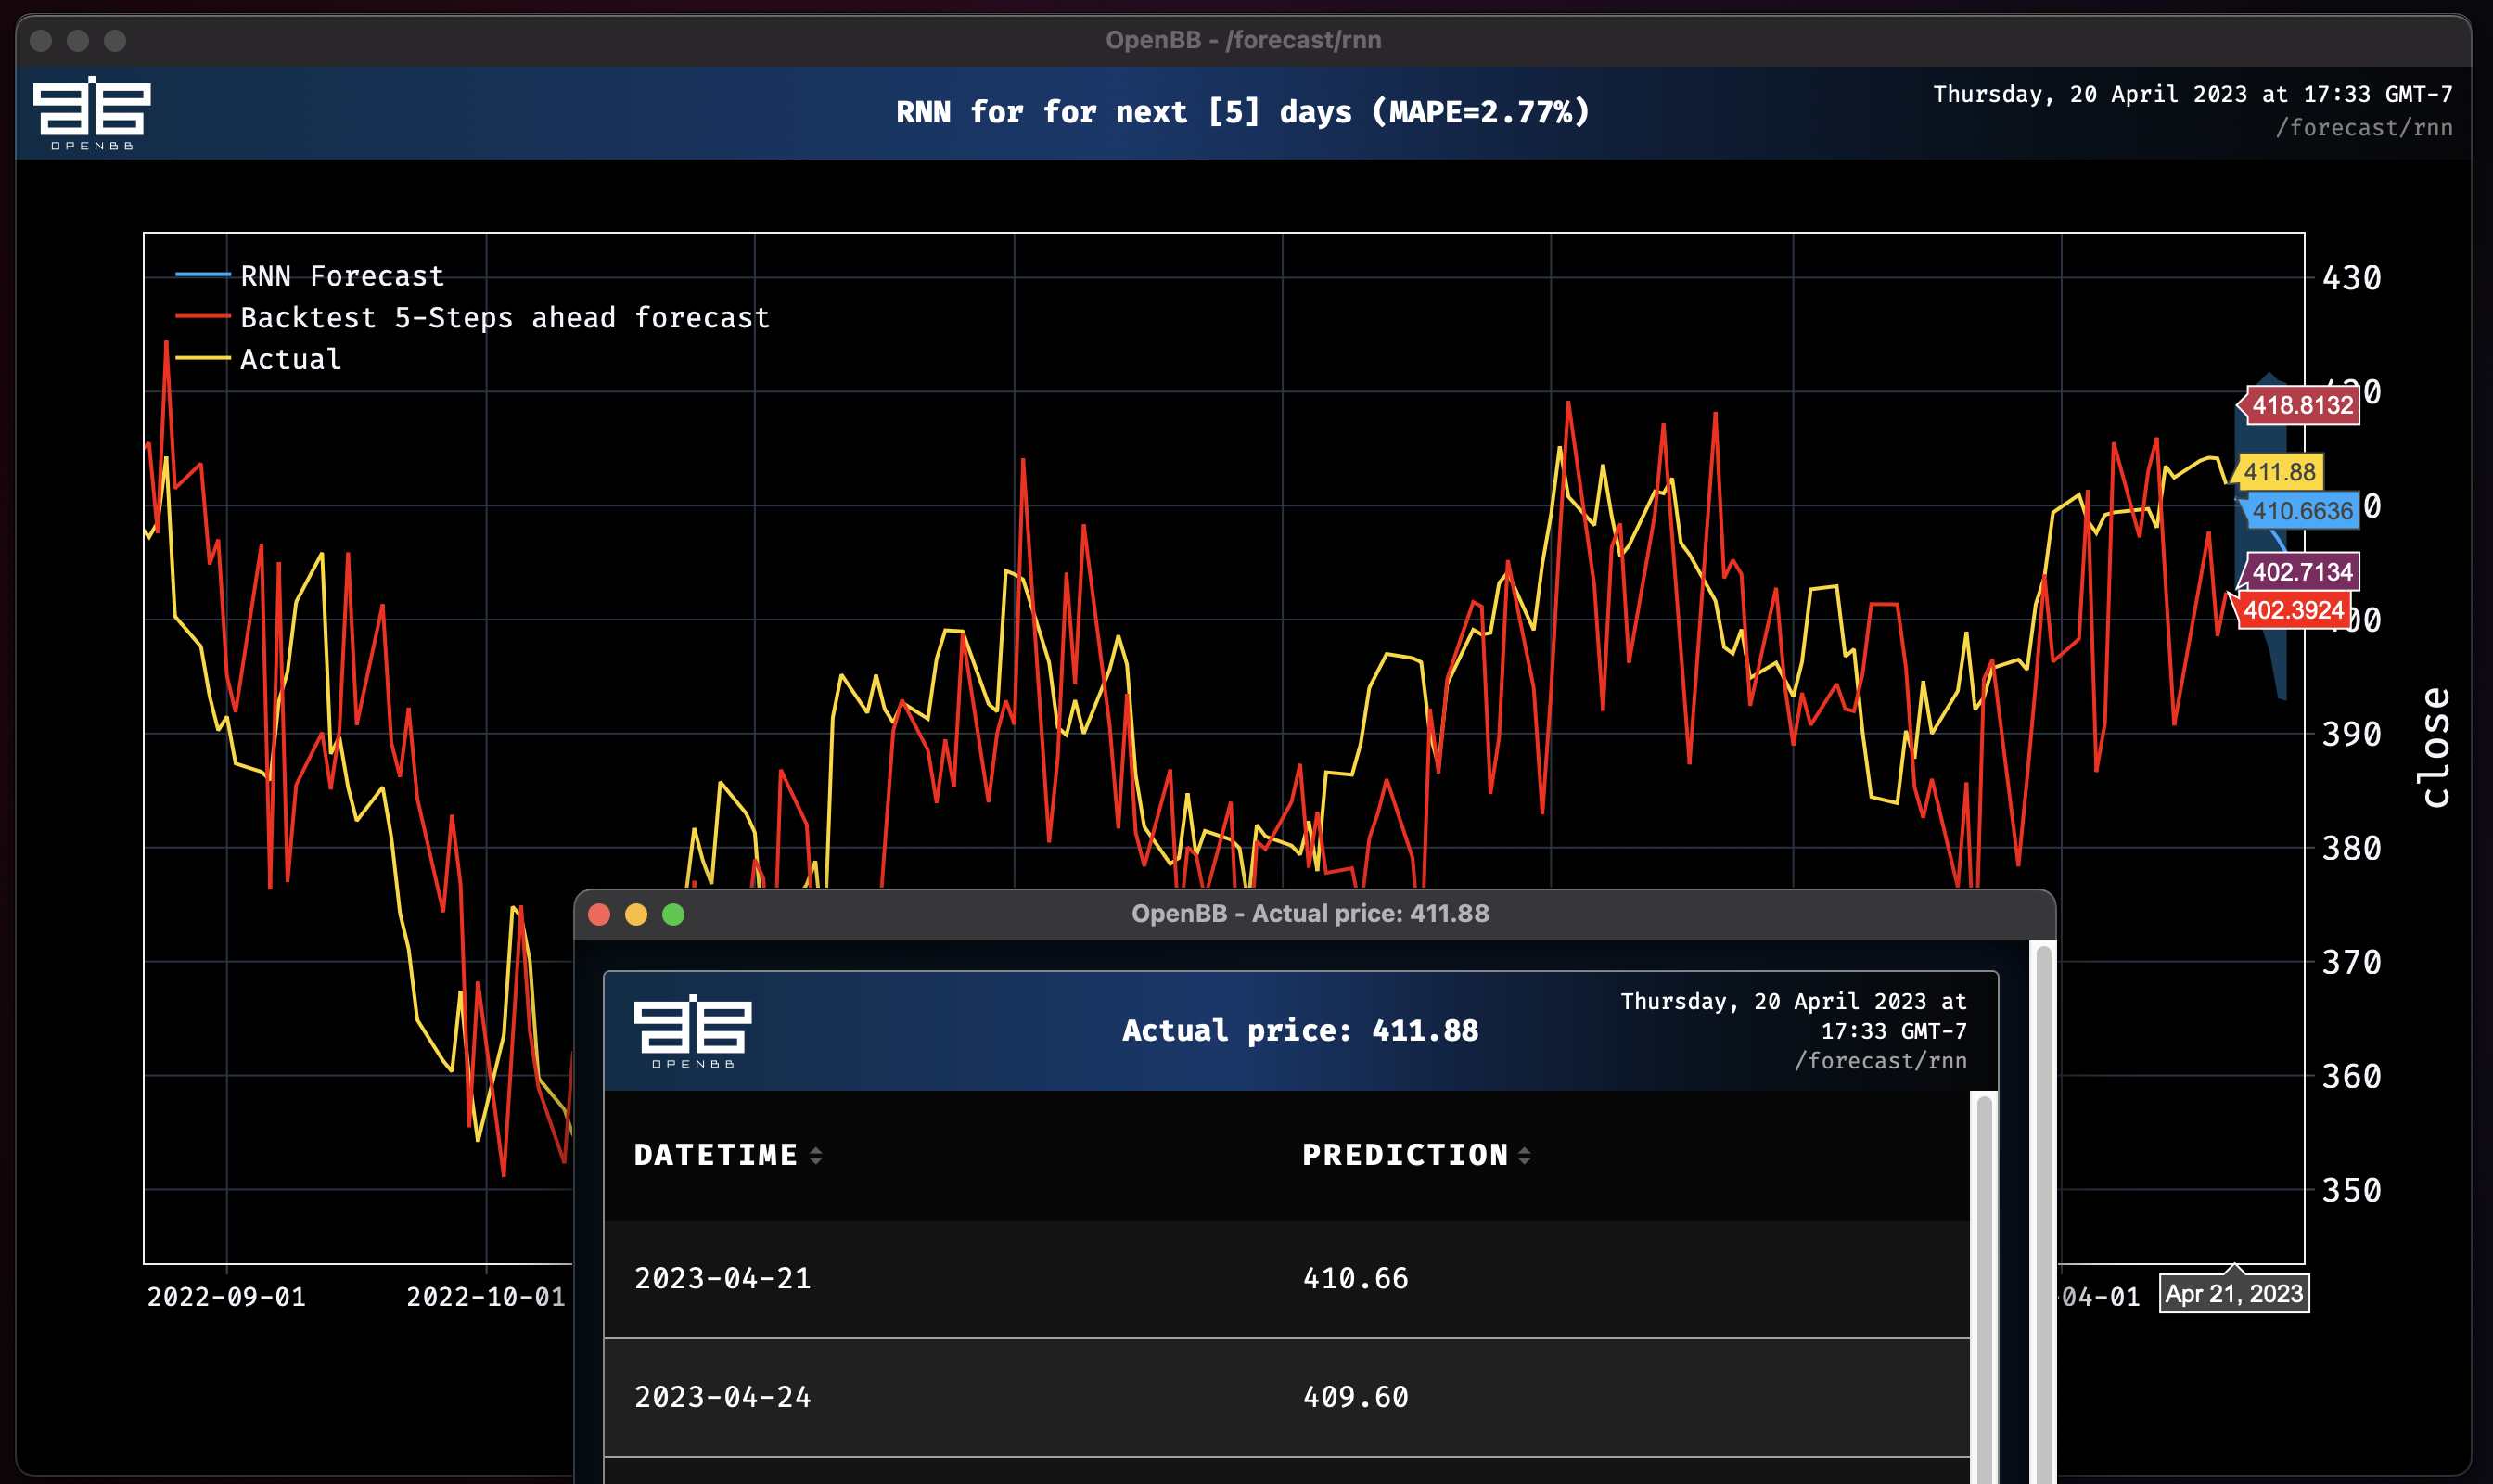
This time lets test with a **Recurrent Neural Network** which by default uses an `LSTM` backbone. We can also choose to test out a `GRU` backbone to experiment. Let's do both and see if we can improve our accuracy and reduce the overall MAPE.
|
|
|
|
```console
|
|
rnn SPY --forecast-only
|
|
|
|
Epoch 50: 100%|█████████████████████████████████████| 214/214 [00:02<00:00, 77.77it/s, loss=-4.31, v_num=logs, train_loss=-4.46, val_loss=-.985]
|
|
|
|
RNN model obtains MAPE: 3.13%
|
|
```
|
|
|
|
|
|
|
|
This result expresses a different view from the Probabilistic Exponential Smoothing Model.
|
|
|
|
For the second task, we would like to change the model type from `LSTM` --> `GRU`. Let's find out of this improves the MAPE score. Use the `-h` flag to understand the particular parameters one can change for RNN. (Please note that the parameters are different for each model).
|
|
|
|
```console
|
|
rnn -h
|
|
|
|
usage: rnn [--hidden-dim HIDDEN_DIM] [--training_length TRAINING_LENGTH] [--naive] [-d {vix,SPY}] [-c TARGET_COLUMN] [-n N_DAYS]
|
|
[-t TRAIN_SPLIT] [-i INPUT_CHUNK_LENGTH] [--force-reset FORCE_RESET] [--save-checkpoints SAVE_CHECKPOINTS]
|
|
[--model-save-name MODEL_SAVE_NAME] [--n-epochs N_EPOCHS] [--model-type MODEL_TYPE] [--dropout DROPOUT] [--batch-size BATCH_SIZE]
|
|
[--end S_END_DATE] [--start S_START_DATE] [--learning-rate LEARNING_RATE] [--residuals] [--forecast-only] [--export-pred-raw]
|
|
[--metric {rmse,mse,mape,smape}] [-h] [--export EXPORT]
|
|
|
|
Perform RNN forecast (Vanilla RNN, LSTM, GRU): https://unit8co.github.io/darts/generated_api/darts.models.forecasting.rnn_model.html
|
|
|
|
options:
|
|
--hidden-dim HIDDEN_DIM
|
|
Size for feature maps for each hidden RNN layer (h_n) (default: 20)
|
|
--training_length TRAINING_LENGTH
|
|
The length of both input (target and covariates) and output (target) time series used during training. Generally
|
|
speaking, training_length should have a higher value than input_chunk_length because otherwise during training the RNN
|
|
is never run for as many iterations as it will during training. (default: 20)
|
|
--naive Show the naive baseline for a model. (default: False)
|
|
-d {vix,SPY}, --dataset {vix,SPY}
|
|
The name of the dataset you want to select (default: None)
|
|
-c TARGET_COLUMN, --target-column TARGET_COLUMN
|
|
The name of the specific column you want to use (default: close)
|
|
-n N_DAYS, --n-days N_DAYS
|
|
prediction days. (default: 5)
|
|
-t TRAIN_SPLIT, --train-split TRAIN_SPLIT
|
|
Start point for rolling training and forecast window. 0.0-1.0 (default: 0.85)
|
|
-i INPUT_CHUNK_LENGTH, --input-chunk-length INPUT_CHUNK_LENGTH
|
|
Number of past time steps for forecasting module at prediction time. (default: 14)
|
|
--force-reset FORCE_RESET
|
|
If set to True, any previously-existing model with the same name will be reset (all checkpoints will be discarded).
|
|
(default: True)
|
|
--save-checkpoints SAVE_CHECKPOINTS
|
|
Whether to automatically save the untrained model and checkpoints. (default: True)
|
|
--model-save-name MODEL_SAVE_NAME
|
|
Name of the model to save. (default: rnn_model)
|
|
--n-epochs N_EPOCHS Number of epochs over which to train the model. (default: 300)
|
|
--model-type MODEL_TYPE
|
|
Enter a string specifying the RNN module type ("RNN", "LSTM" or "GRU") (default: LSTM)
|
|
--dropout DROPOUT Fraction of neurons affected by Dropout, from 0 to 1. (default: 0)
|
|
--batch-size BATCH_SIZE
|
|
Number of time series (input and output) used in each training pass (default: 32)
|
|
--end S_END_DATE The end date (format YYYY-MM-DD) to select for testing (default: None)
|
|
--start S_START_DATE The start date (format YYYY-MM-DD) to select for testing (default: None)
|
|
--learning-rate LEARNING_RATE
|
|
Learning rate during training. (default: 0.001)
|
|
--residuals Show the residuals for the model. (default: False)
|
|
--forecast-only Do not plot the historical data without forecasts. (default: False)
|
|
--export-pred-raw Export predictions to a csv file. (default: False)
|
|
--metric {rmse,mse,mape,smape}
|
|
Calculate precision based on a specific metric (rmse, mse, mape) (default: mape)
|
|
-h, --help show this help message (default: False)
|
|
--export EXPORT Export figure into png, jpg, pdf, svg (default: )
|
|
|
|
For more information and examples, use 'about rnn' to access the related guide.
|
|
```
|
|
|
|
Lets change the `--model-type` parameter to `GRU` and rerun.
|
|
|
|
```console
|
|
rnn SPY --model-type GRU --forecast-only
|
|
|
|
Epoch 85: 100%|█████████████████████████████████████| 214/214 [00:02<00:00, 75.10it/s, loss=-4.45, v_num=logs, train_loss=-4.35, val_loss=-2.35]
|
|
|
|
RNN model obtains MAPE: 2.77%
|
|
```
|
|
|
|
|
|
|
|
We improved the accuracy score, great work!
|
|
|
|
:::note
|
|
The take away for this is that all models should work out of the box when forecasting for a particular time series. One can switch the target by specifying a `-c` for `TARGET_COLUMN` and test out performance with multiple different models with a single command.
|
|
:::
|
|
|
|
## Sample Workflow #2 (Advanced)
|
|
|
|
To build successful models and improve accuracy over time, it is important to capture external data related to the time series you are training on. This can be seen in everyday applications:
|
|
|
|
- Observed rainfalls and known weather forecasts can help to predict hydro and solar electricity production
|
|
- Recently-observed activity on an e-commerce website can help predict future sales.
|
|
- Making the model aware of up-coming holidays can help sales forecasting.
|
|
|
|
In fact, more often than not, strictly relying on the history of a time series
|
|
to predict its future is missing a lot of valuable information.
|
|
|
|
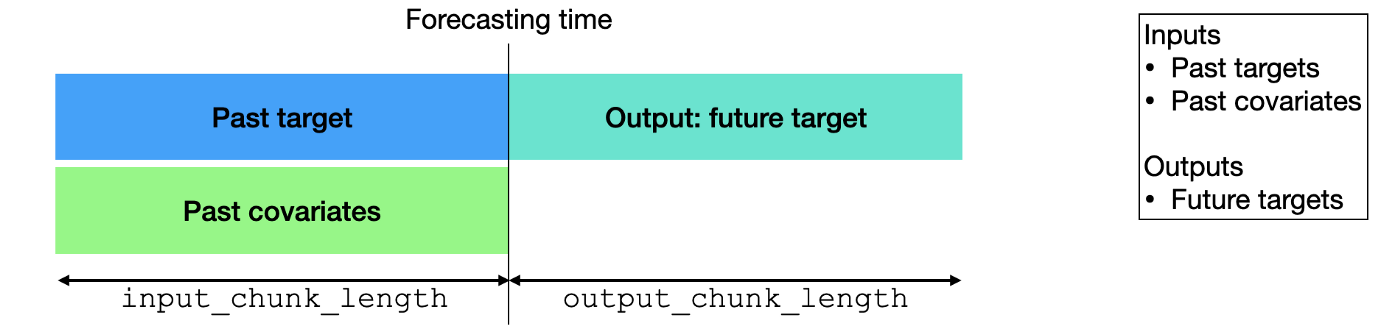
**Past covariates** are time series whose past values are known at prediction
|
|
time. Those series often contain values that have to be observed to be known.
|
|
|
|
|
|
|
|
To explore this topic more, please read the [blog post](https://medium.com/unit8-machine-learning-publication/time-series-forecasting-using-past-and-future-external-data-with-darts-1f0539585993) written by the authors of Darts.
|
|
|
|
Note that only the following models can handle `past_covariates`: `BlockRNNModel`, `NBEATSModel`, `TCNModel`, `TransformerModel`, `RegressionModel` (incl. `LinearRegressionModel`), `Temporal Fusion Transformer`
|
|
|
|
Earlier on in the guide we managed to accomplish the following:
|
|
|
|
- Load multiple datasets.
|
|
- Combine datasets.
|
|
- Rename columns.
|
|
- Delete columns.
|
|
|
|
We will continue this workflow by:
|
|
|
|
- Adding some correlation analysis.
|
|
- Train models with `past_covariates`.
|
|
|
|
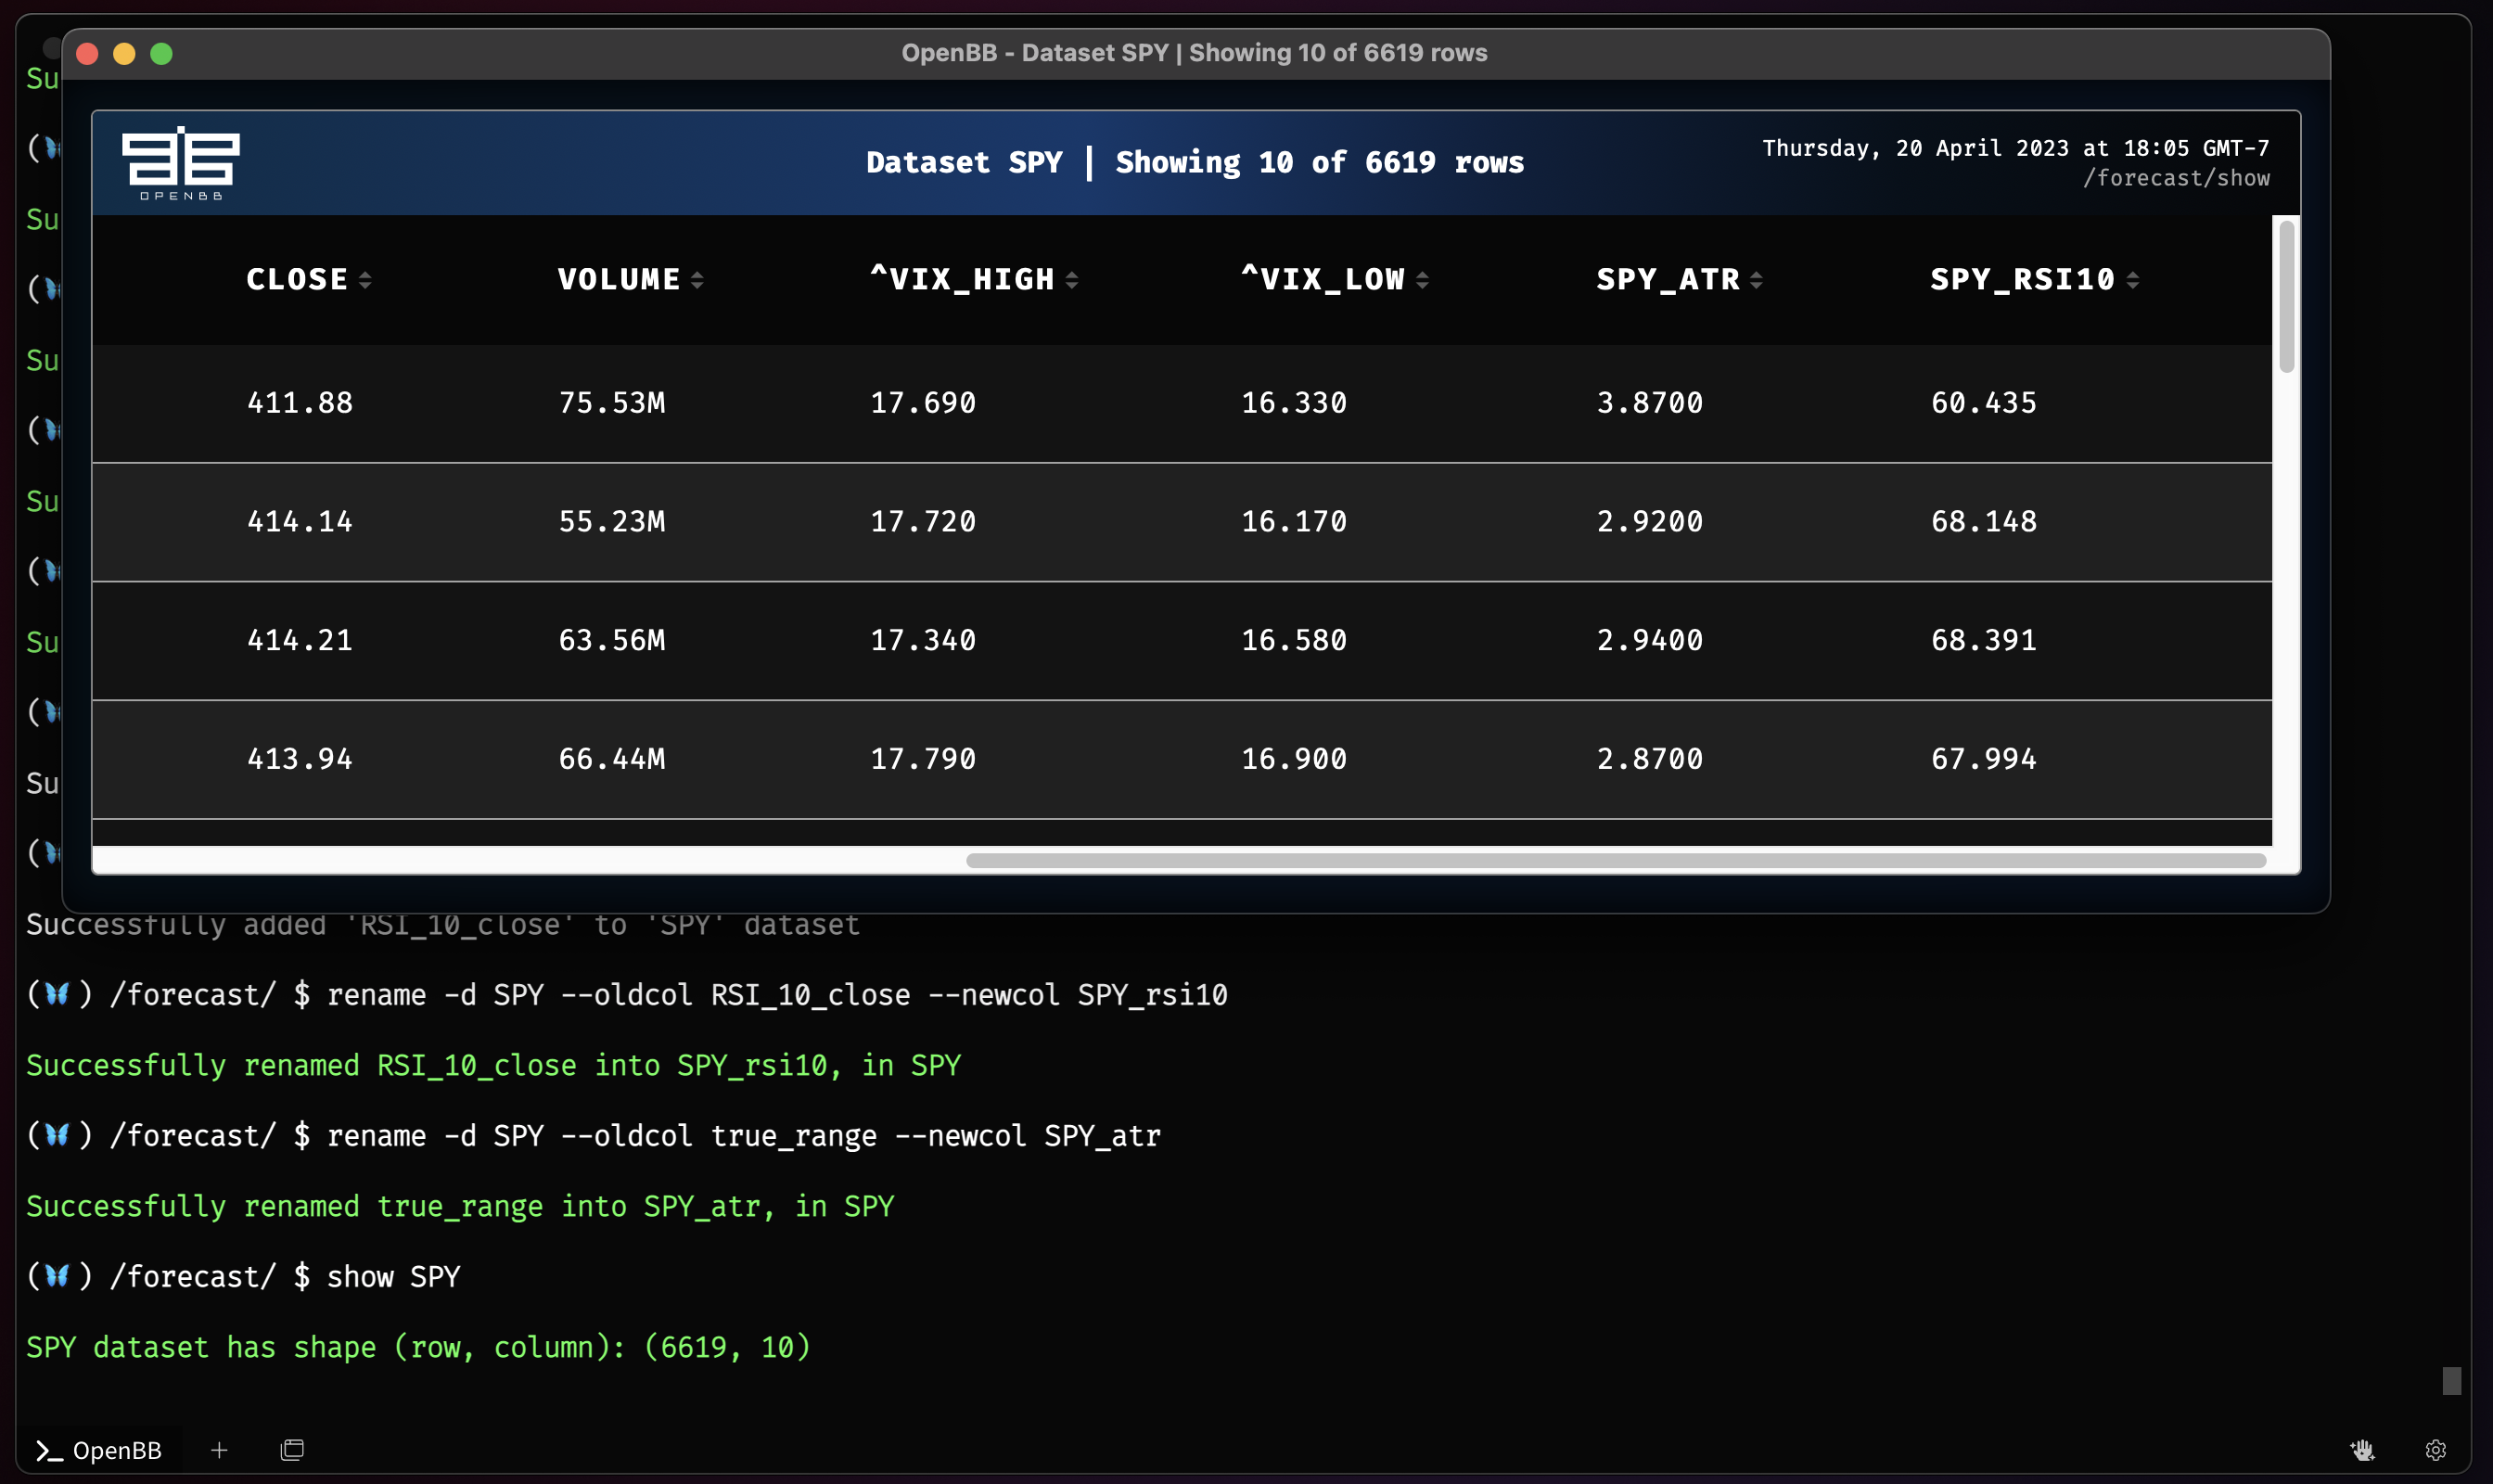
For practice, let's start fresh and rebuild the same dataset. The [OpenBB Routine Scripts](/terminal/usage/routines/introduction-to-routines) can make quick work out of this chore. Copy the block below and create a new `.openbb` file, in `~/OpenBBUserData/routines/`, to follow along.
|
|
|
|
```console
|
|
/stocks
|
|
load SPY --start 1997-01-01
|
|
forecast
|
|
..
|
|
load ^VIX --start 1997-01-01
|
|
forecast
|
|
combine --dataset SPY -c ^VIX.high
|
|
combine --dataset SPY -c ^VIX.low
|
|
delete --delete SPY.adj_close
|
|
delete --delete SPY.stock_splits
|
|
delete --delete SPY.dividends
|
|
atr -d SPY
|
|
rsi -d SPY
|
|
rename -d SPY --oldcol RSI_10_close --newcol SPY_rsi10
|
|
rename -d SPY --oldcol true_range --newcol SPY_atr
|
|
show SPY
|
|
```
|
|
|
|
Restart the Terminal to ensure that the routine file is found by the `/exe` command, and then run it.
|
|
|
|
```console
|
|
exe --file forecast_demo.openbb
|
|
```
|
|
|
|
|
|
|
|
### brnn
|
|
|
|
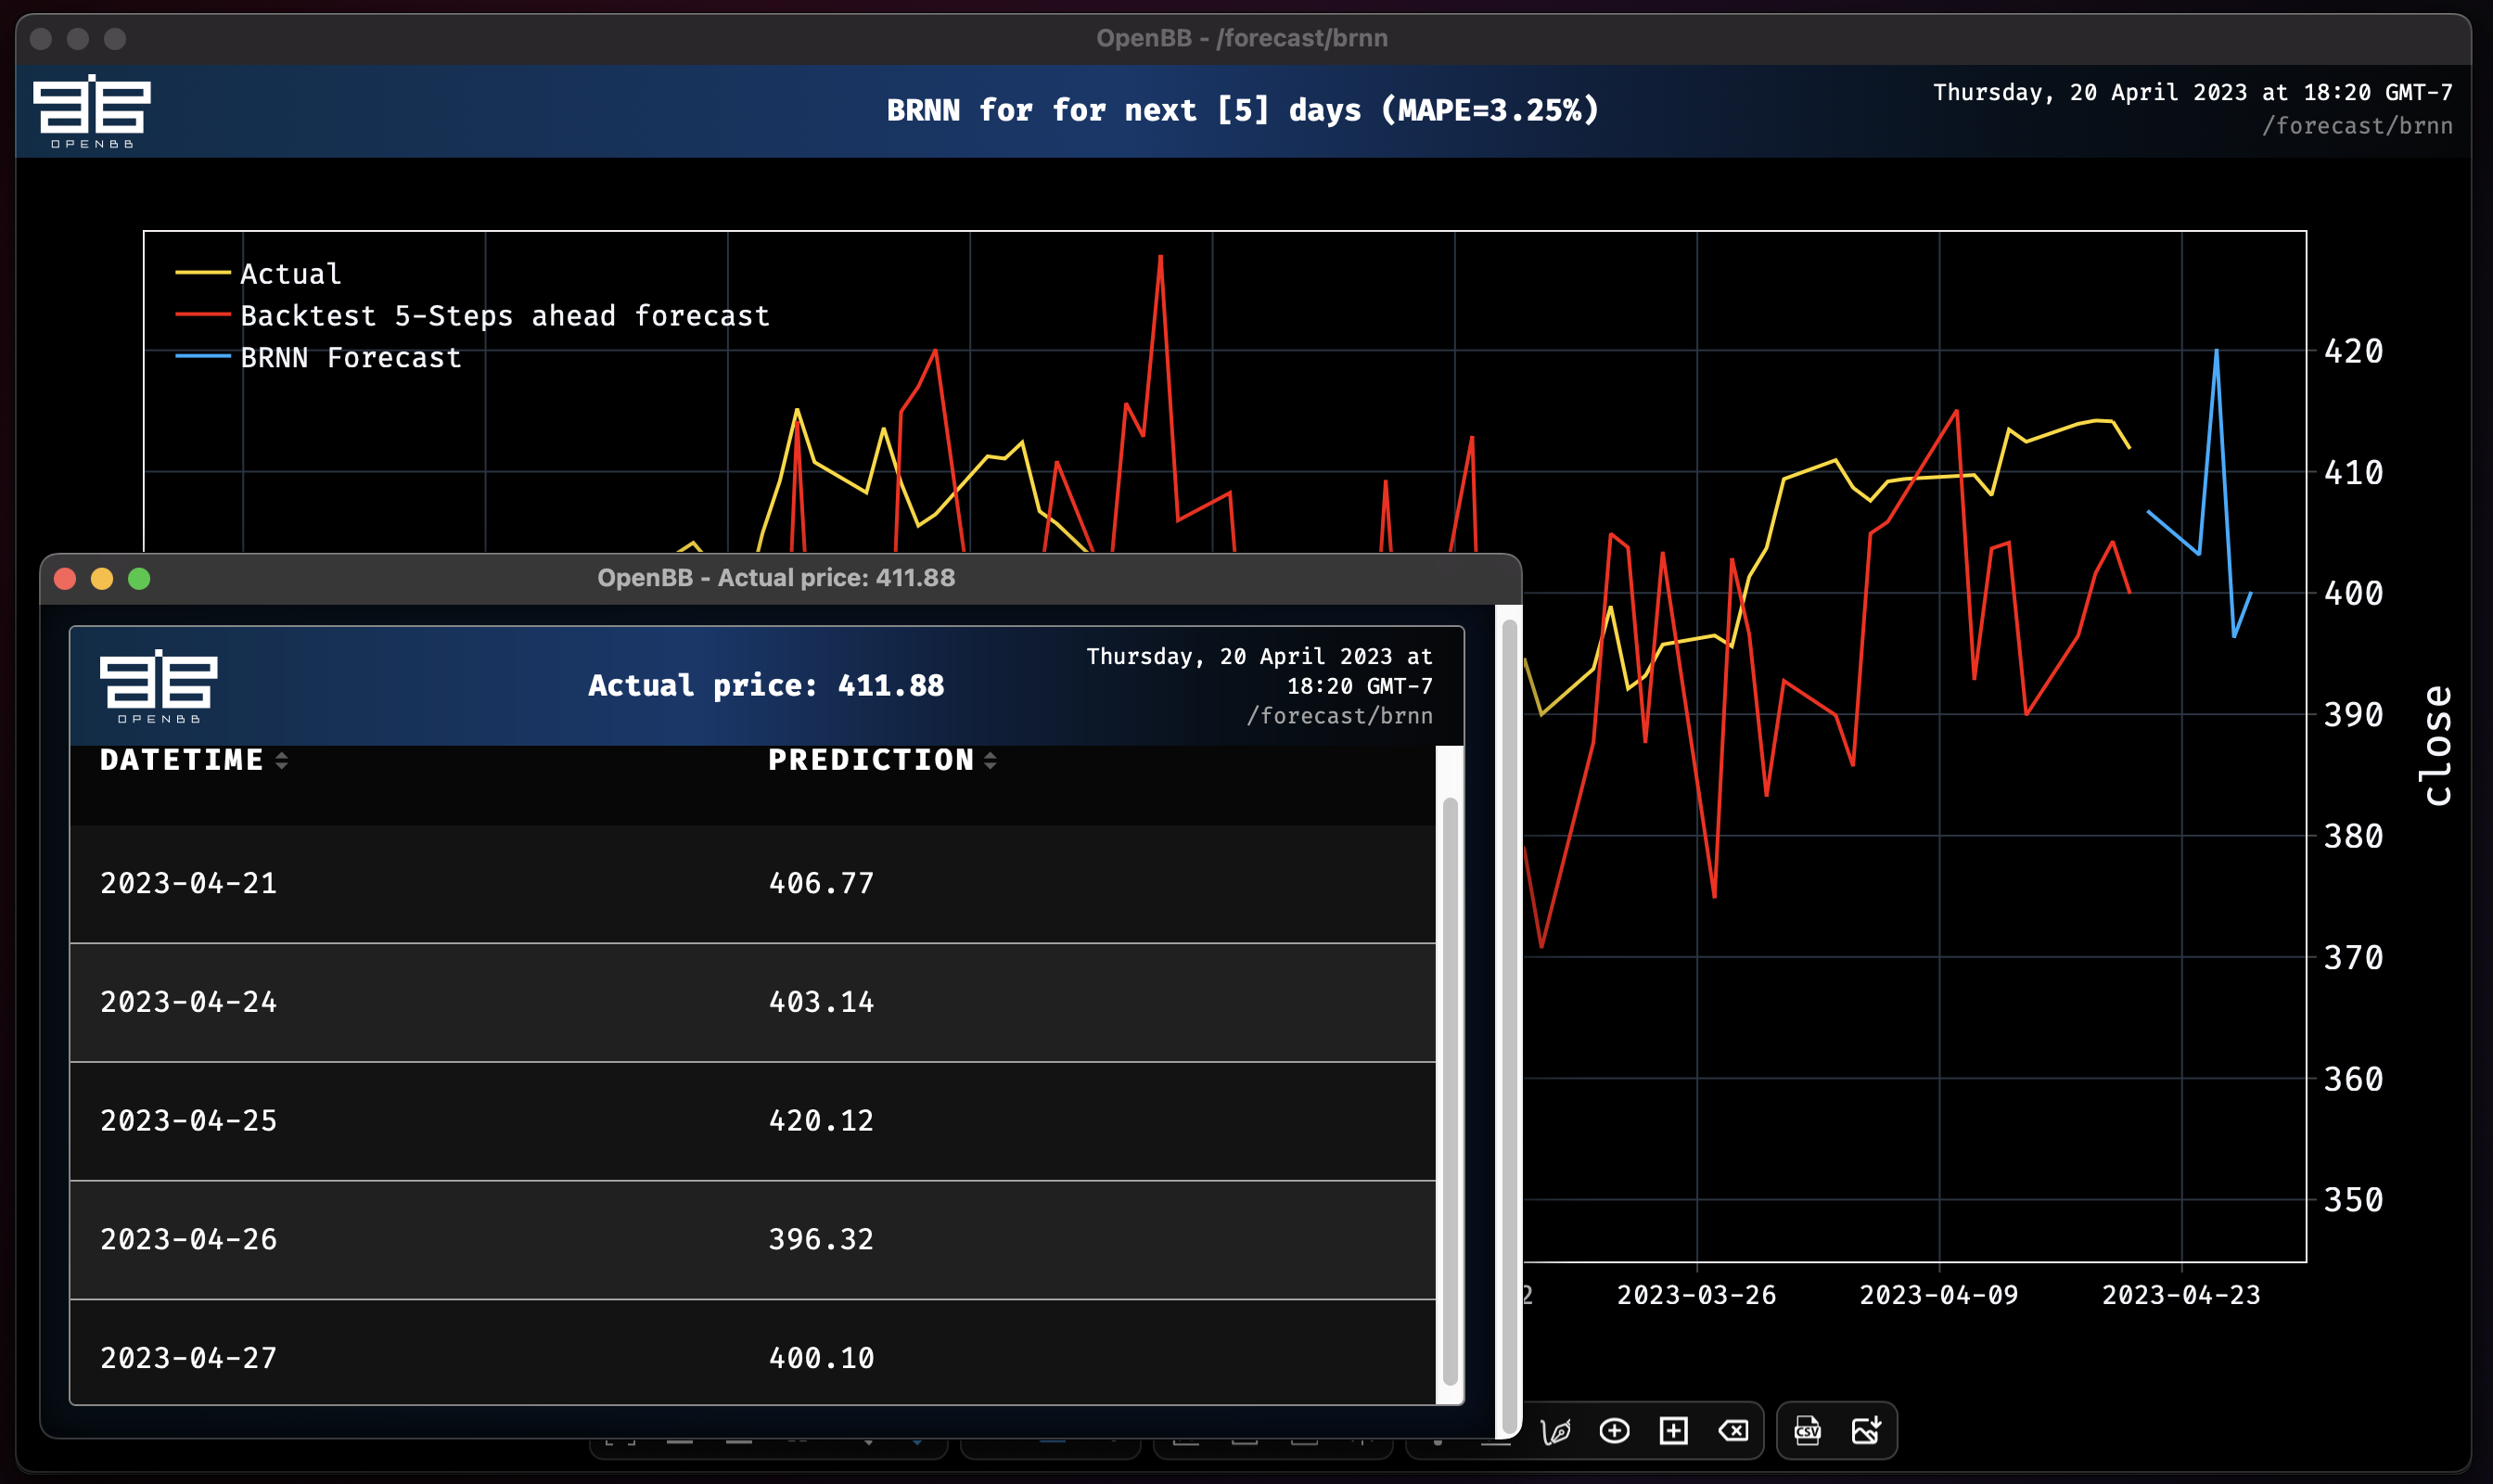
Now take the new dataset and train a simple `Block RNN` model on SPY's `close` price, and again using `past_covariates` on a single column.
|
|
|
|
Without past covariates:
|
|
|
|
```console
|
|
brnn SPY --forecast-only
|
|
```
|
|
|
|
```console
|
|
Epoch 196: 100%|███████████████████████████████████| 214/214 [00:01<00:00, 107.42it/s, loss=-4.09, v_num=logs, train_loss=-4.07, val_loss=-1.53]
|
|
|
|
Block RNN model obtains MAPE: 3.25%
|
|
```
|
|
|
|
|
|
|
|
With covariates:
|
|
|
|
To use any covariates, there are two options:
|
|
|
|
- specify specific columns with `--past-covariates`
|
|
- specify all columns as past covariates except the one you are forecasting
|
|
`--all-past-covariates`
|
|
|
|
```console
|
|
brnn SPY --forecast-only --past-covariates volume
|
|
```
|
|
|
|
```console
|
|
Covariate #0: volume
|
|
Epoch 86: 100%|████████████████████████████████████████| 214/214 [00:02<00:00, 74.77it/s, loss=-4, v_num=logs, train_loss=-4.19, val_loss=-1.53]
|
|
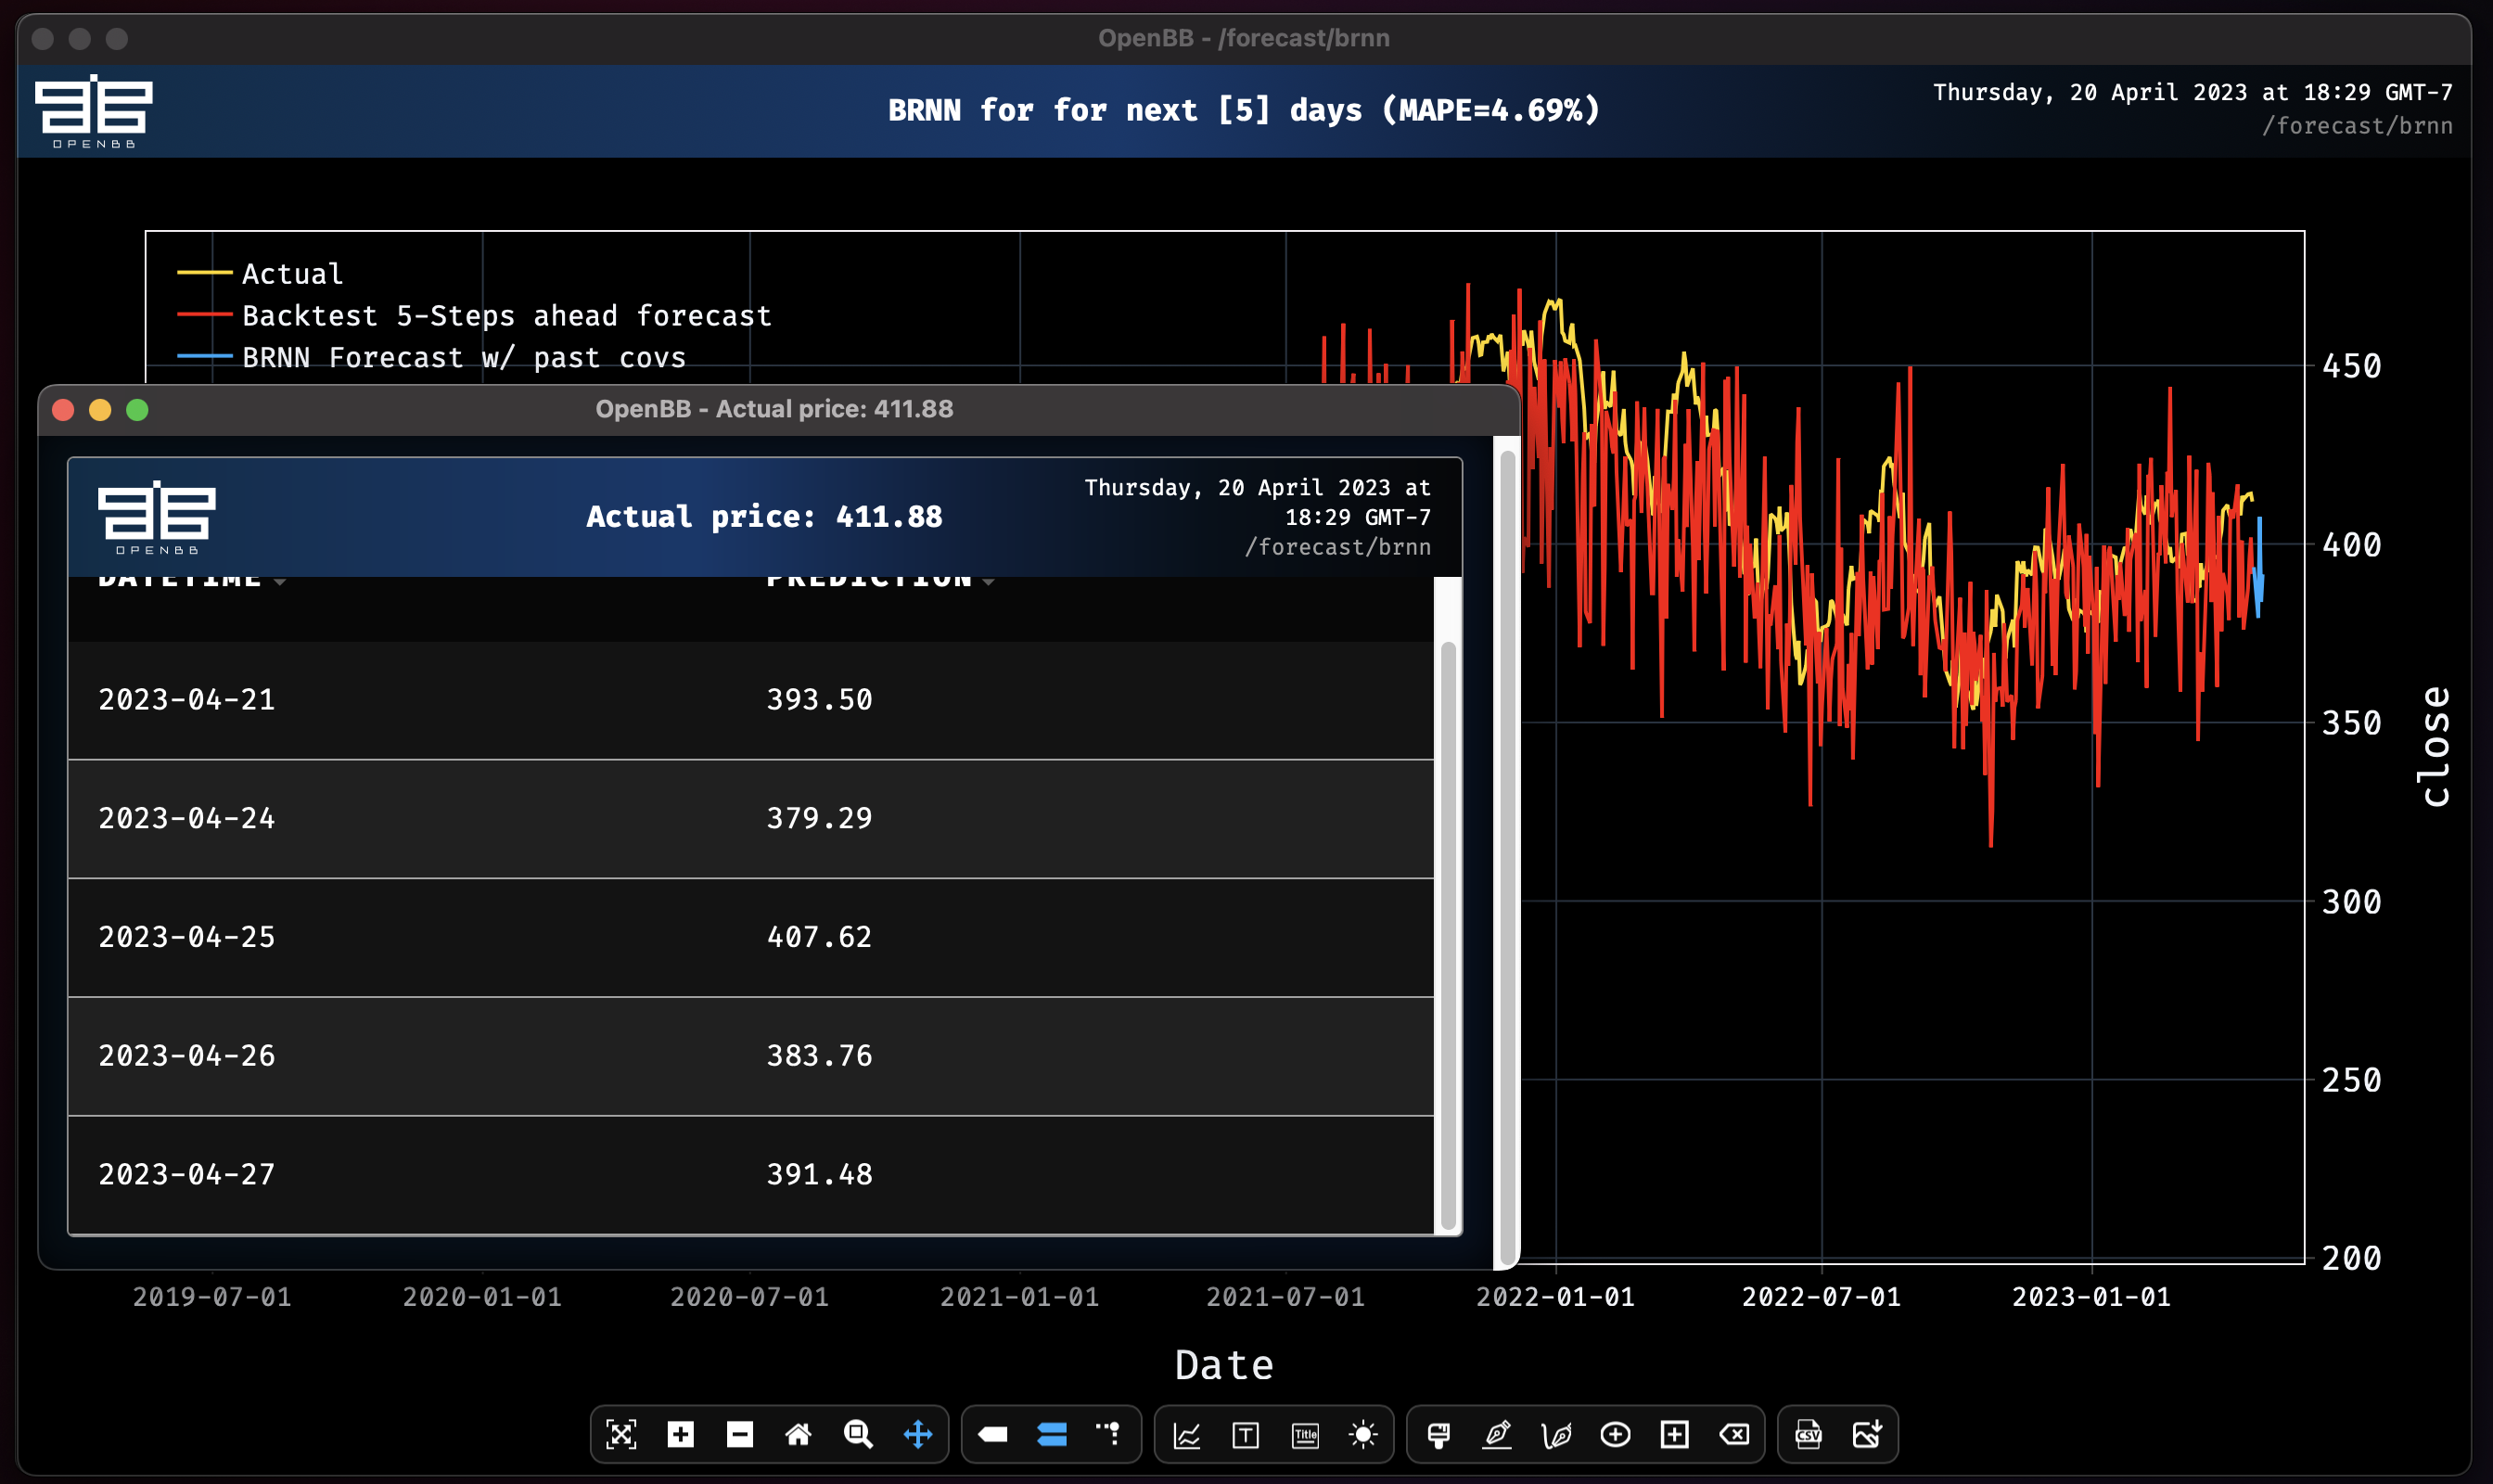
Block RNN model obtains MAPE: 4.69%
|
|
```
|
|
|
|
|
|
|
|
It is evident here that adding in the external variable of `volume` negatively affected the accuracy.
|
|
|
|
Let's try adding a new column for the 200-day moving average.
|
|
|
|
```console
|
|
ema -d SPY --period 200/brnn -d SPY --past-covariates EMA_200
|
|
```
|
|
|
|
```console
|
|
Successfully added 'EMA_200' to 'SPY' dataset
|
|
Covariate #0: EMA_200
|
|
Epoch 79: 100%|█████████████████████████████████████| 214/214 [00:02<00:00, 87.78it/s, loss=-3.81, v_num=logs, train_loss=-3.78, val_loss=-.435
|
|
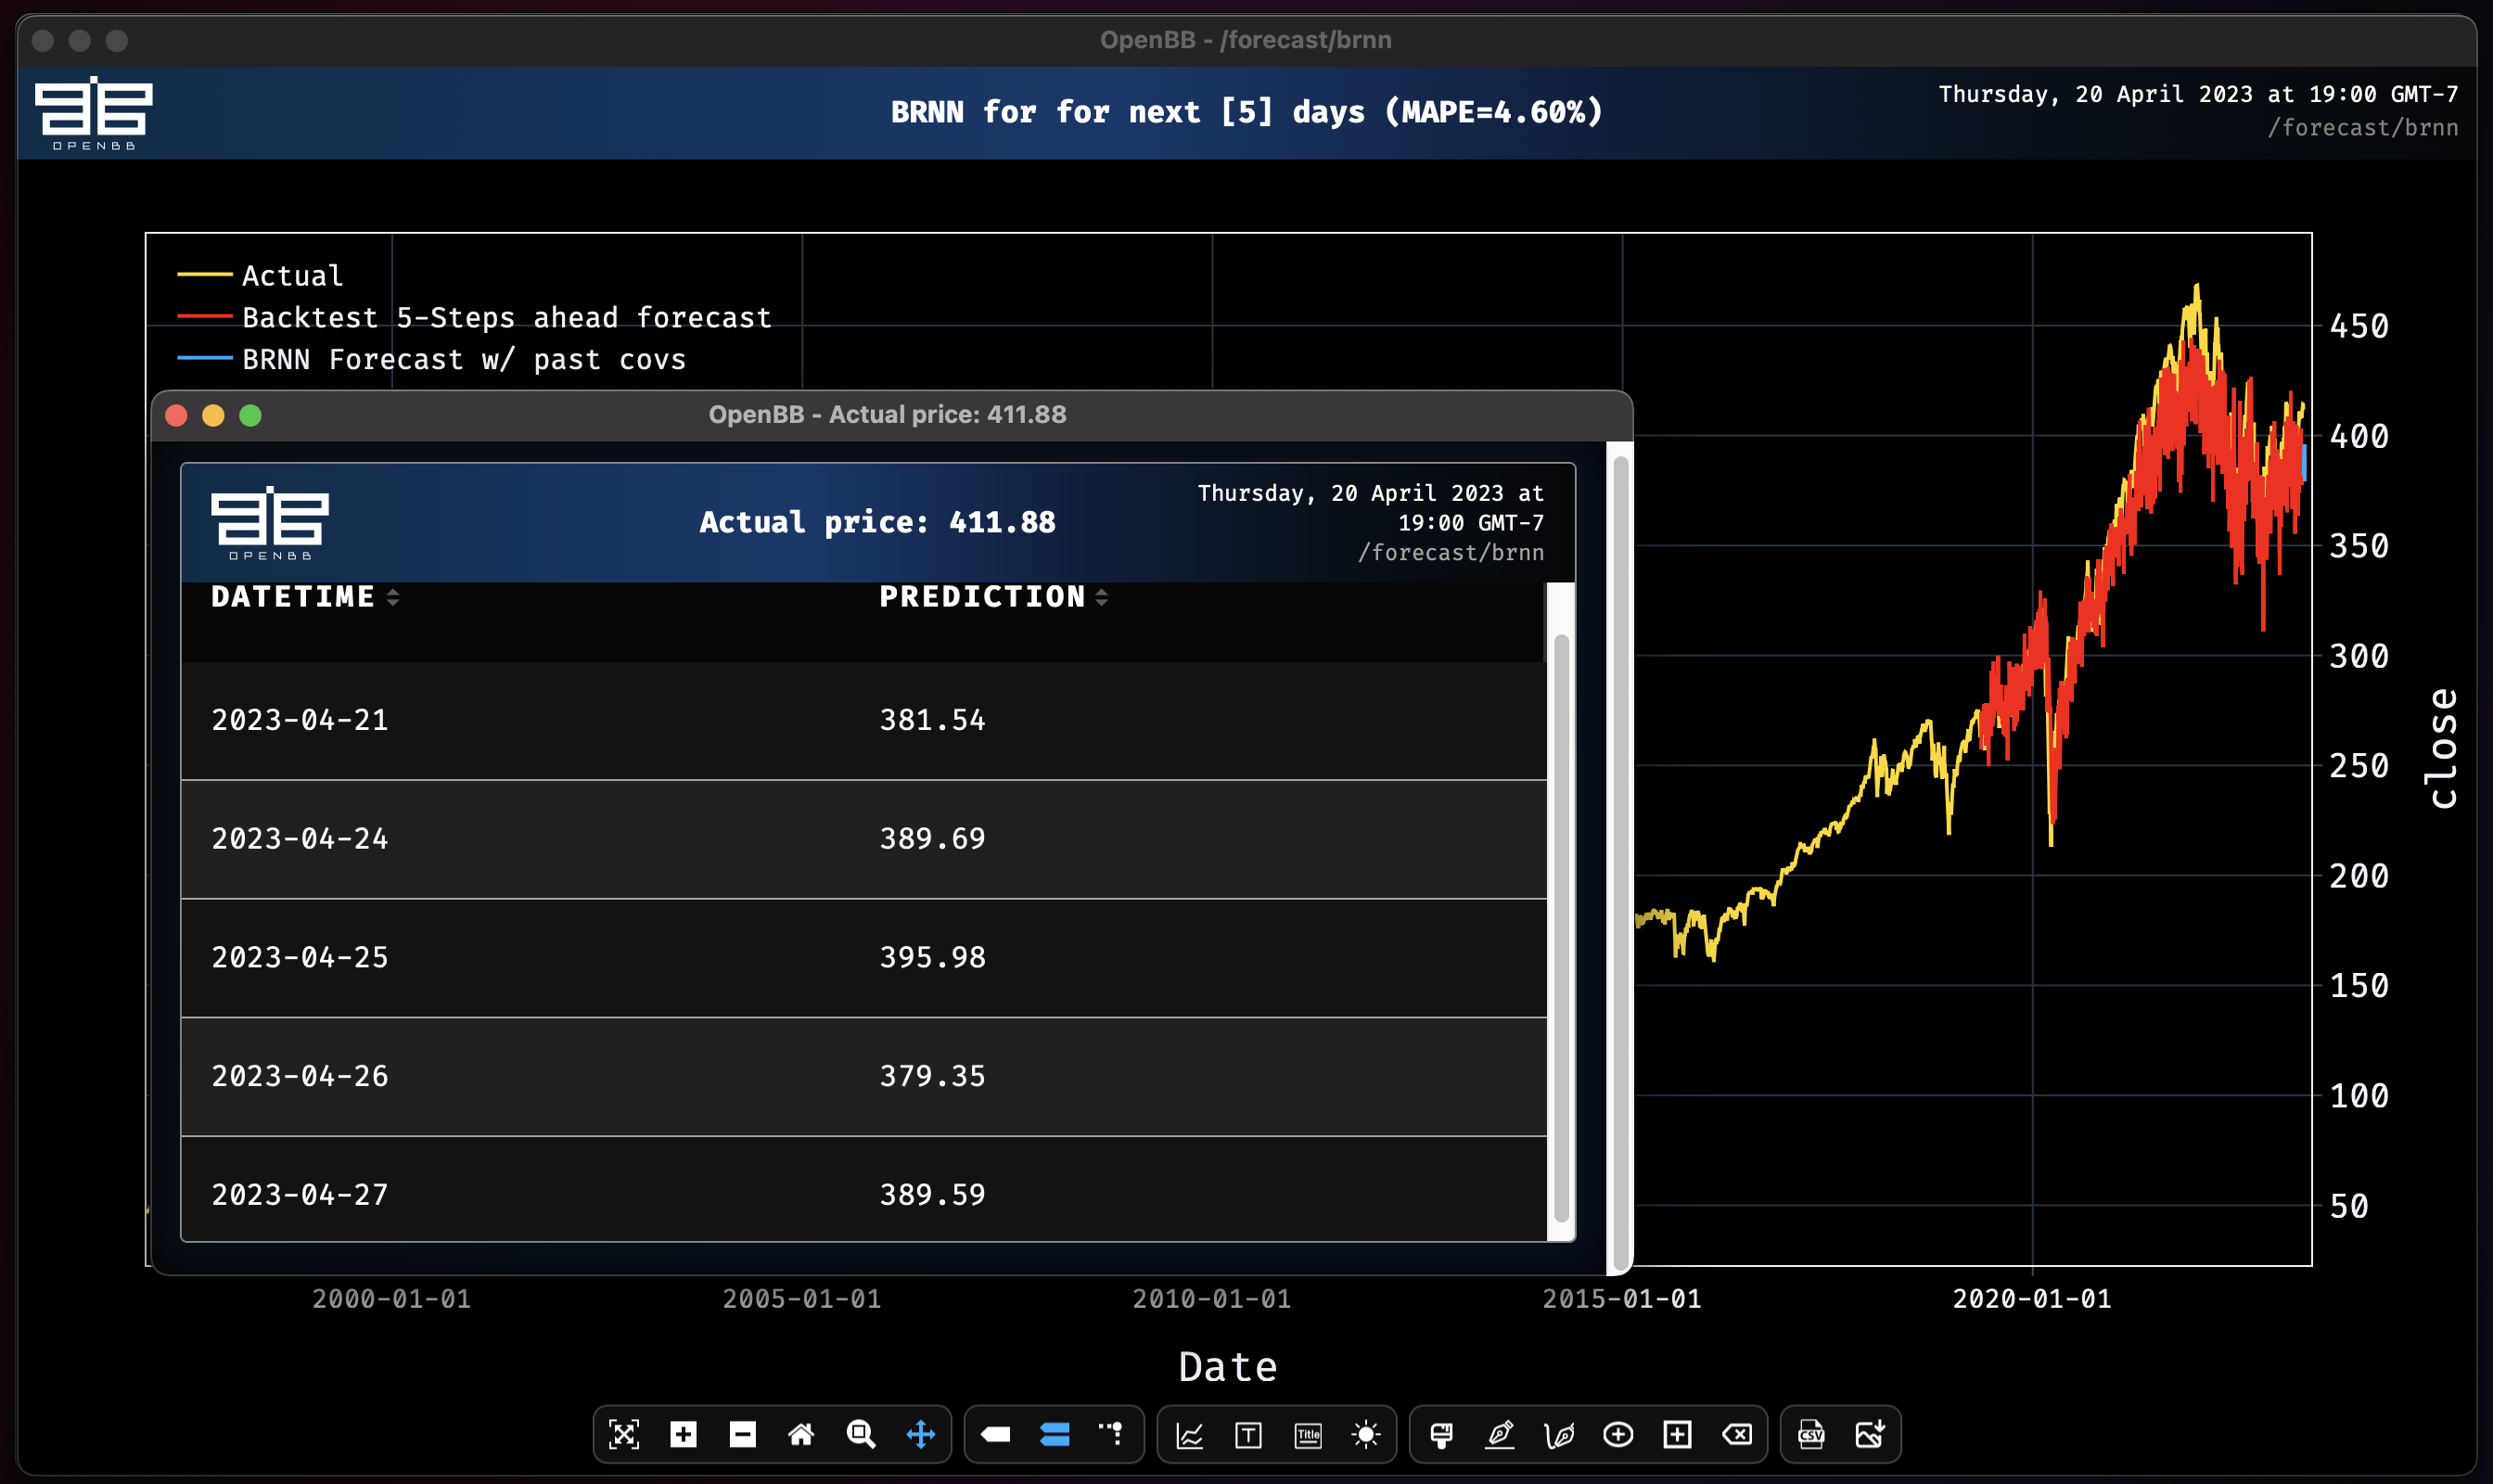
Block RNN model obtains MAPE: 4.60%
|
|
```
|
|
|
|
|
|
|
|
This isn't an improvement. It's possible that there is too much noise in the data, so let's try shortening the length of time being used to train.
|
|
|
|
```console
|
|
|
|
brnn -d SPY --past-covariates EMA_200 -t 0.95
|
|
|
|
Covariate #0: EMA_200
|
|
Epoch 87: 100%|█████████████████████████████████████| 215/215 [00:02<00:00, 82.81it/s, loss=-3.87, v_num=logs, train_loss=-4.29, val_loss=-1.59]
|
|
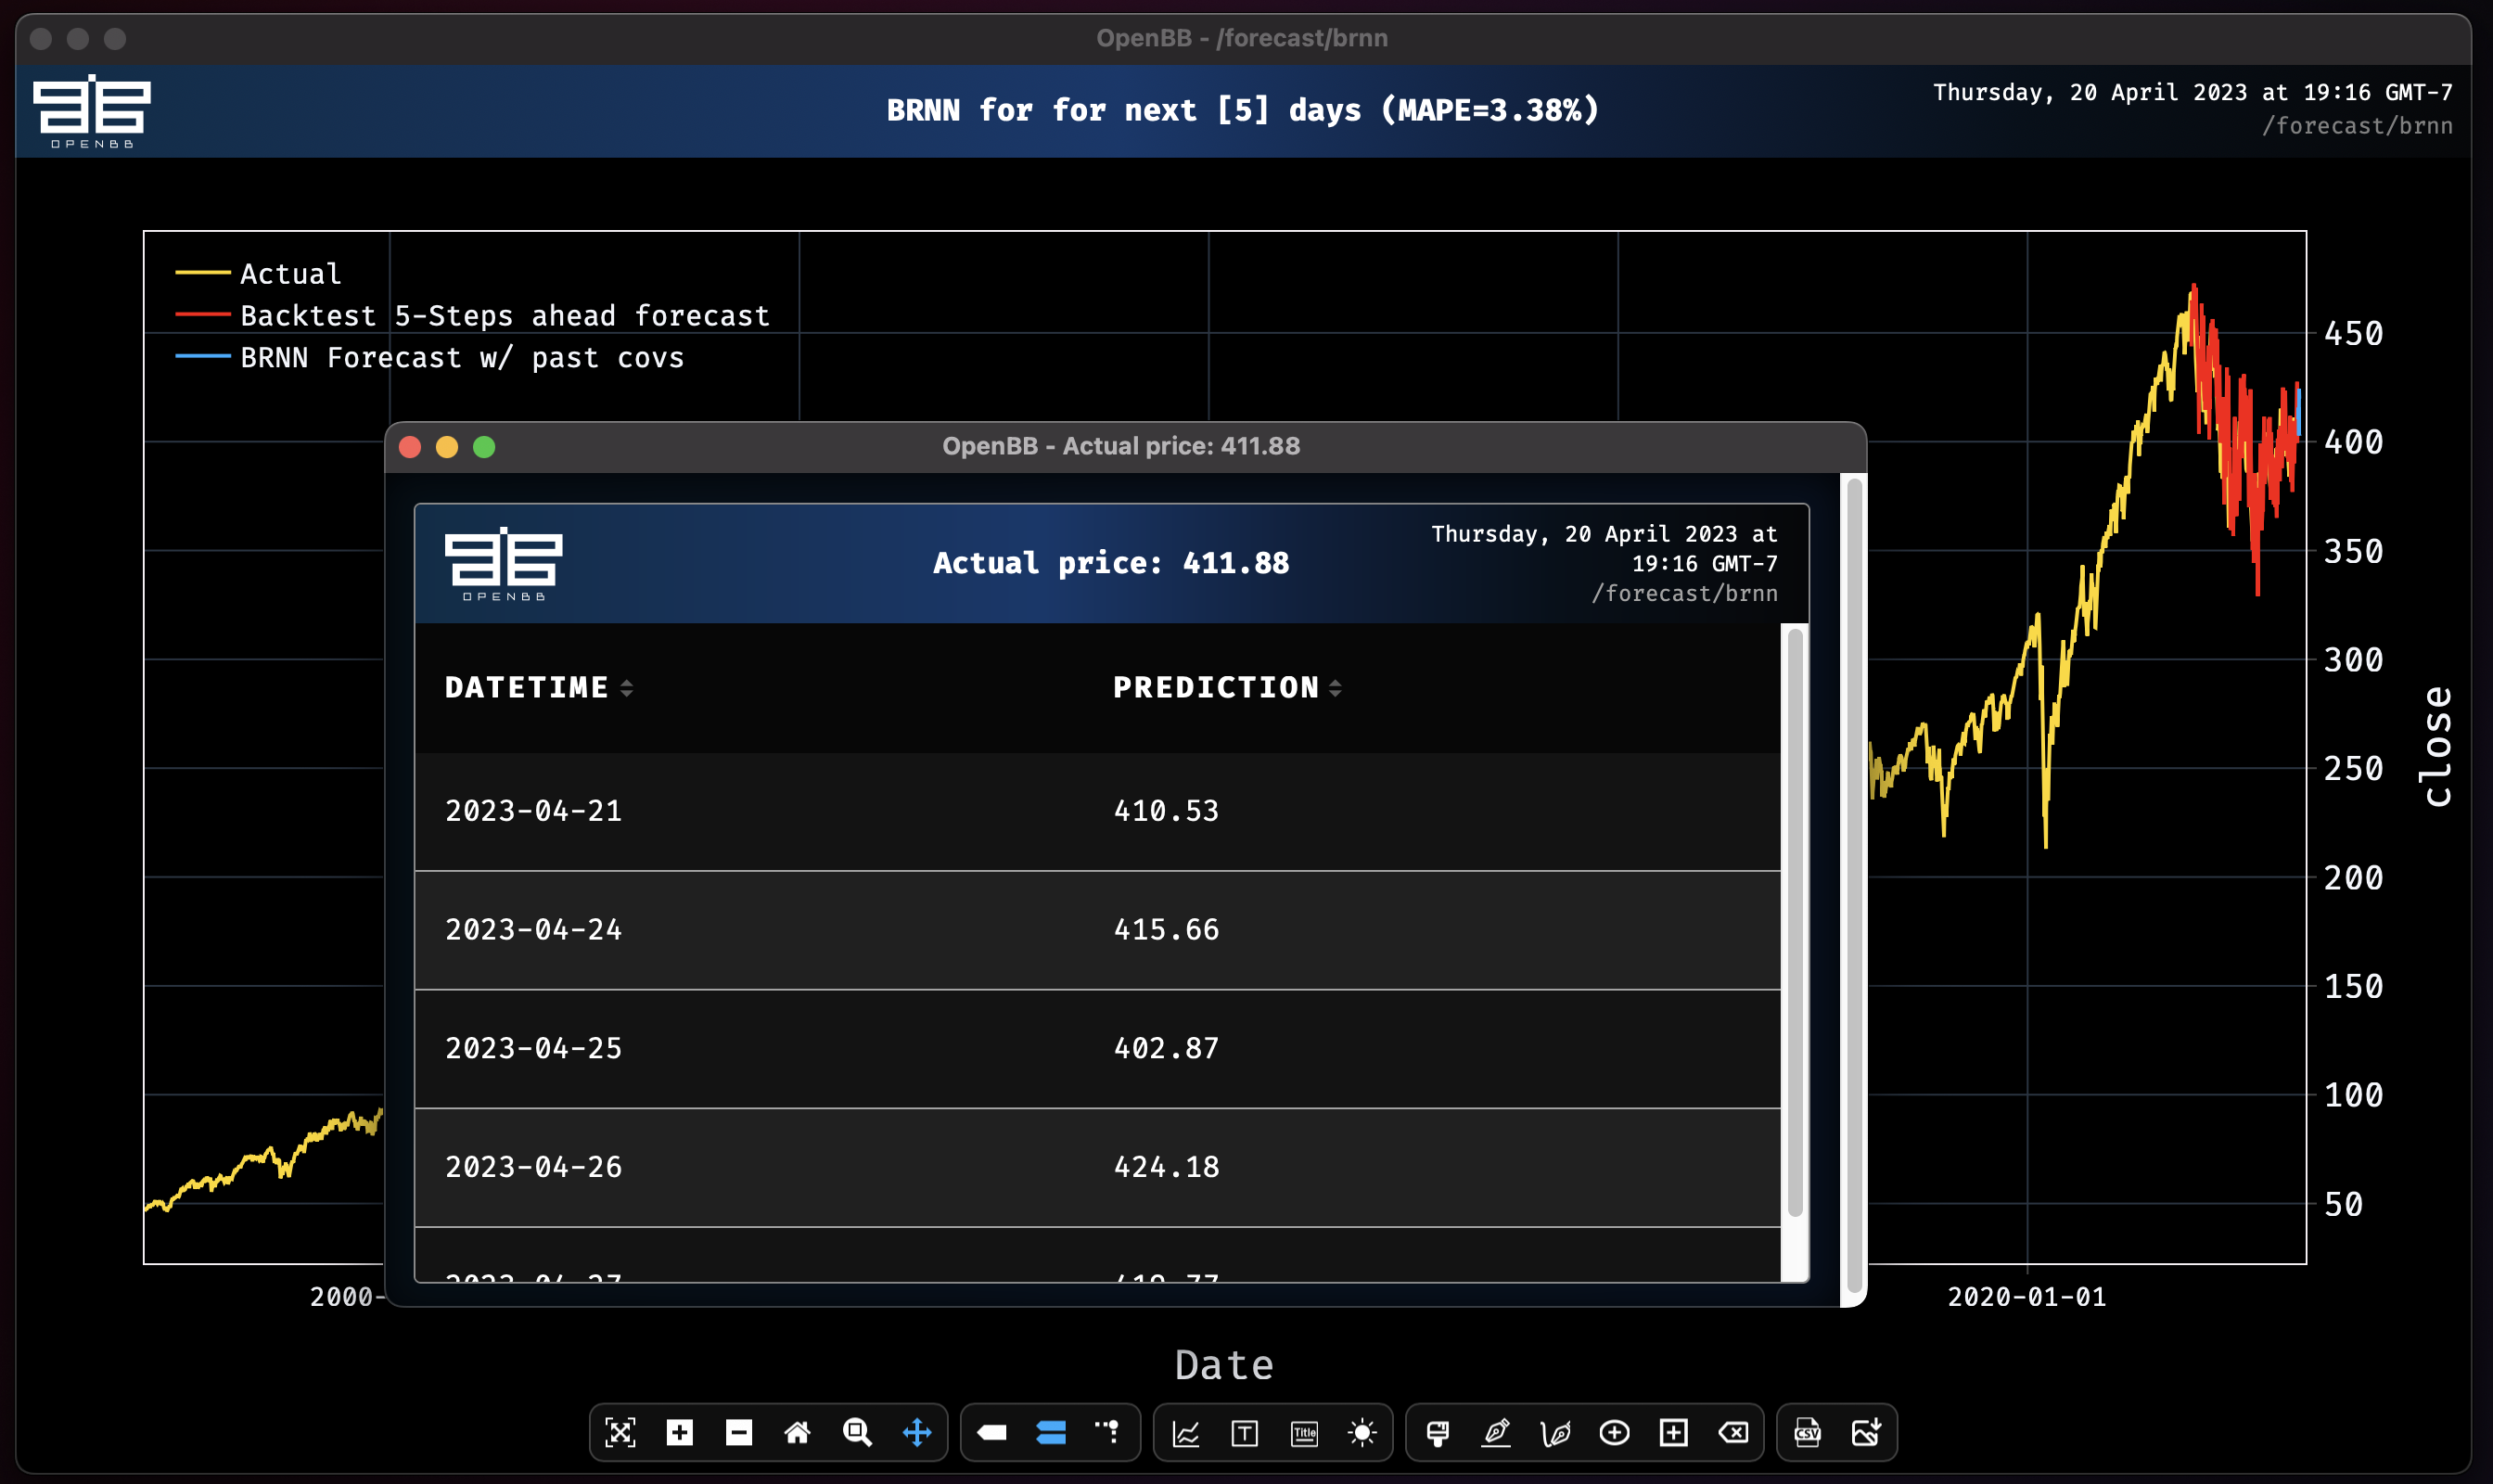
Block RNN model obtains MAPE: 3.38%
|
|
```
|
|
|
|
|
|
|
|
Removing the 2020 volatility from the window of observation made a massive improvement to the forecast. Now let's see add all the columns in the dataset as past covariates.
|
|
|
|
```console
|
|
brnn -d SPY --all-past-covariates -t 0.95
|
|
|
|
Covariate #0: open
|
|
Covariate #1: high
|
|
Covariate #2: low
|
|
Covariate #3: volume
|
|
Covariate #4: ^VIX_high
|
|
Covariate #5: ^VIX_low
|
|
Covariate #6: SPY_atr
|
|
Covariate #7: SPY_rsi10
|
|
Covariate #8: EMA_200
|
|
Epoch 39: 100%|█████████████████████████████████████| 215/215 [00:02<00:00, 83.50it/s, loss=-3.92, v_num=logs, train_loss=-4.03, val_loss=-2.14]
|
|
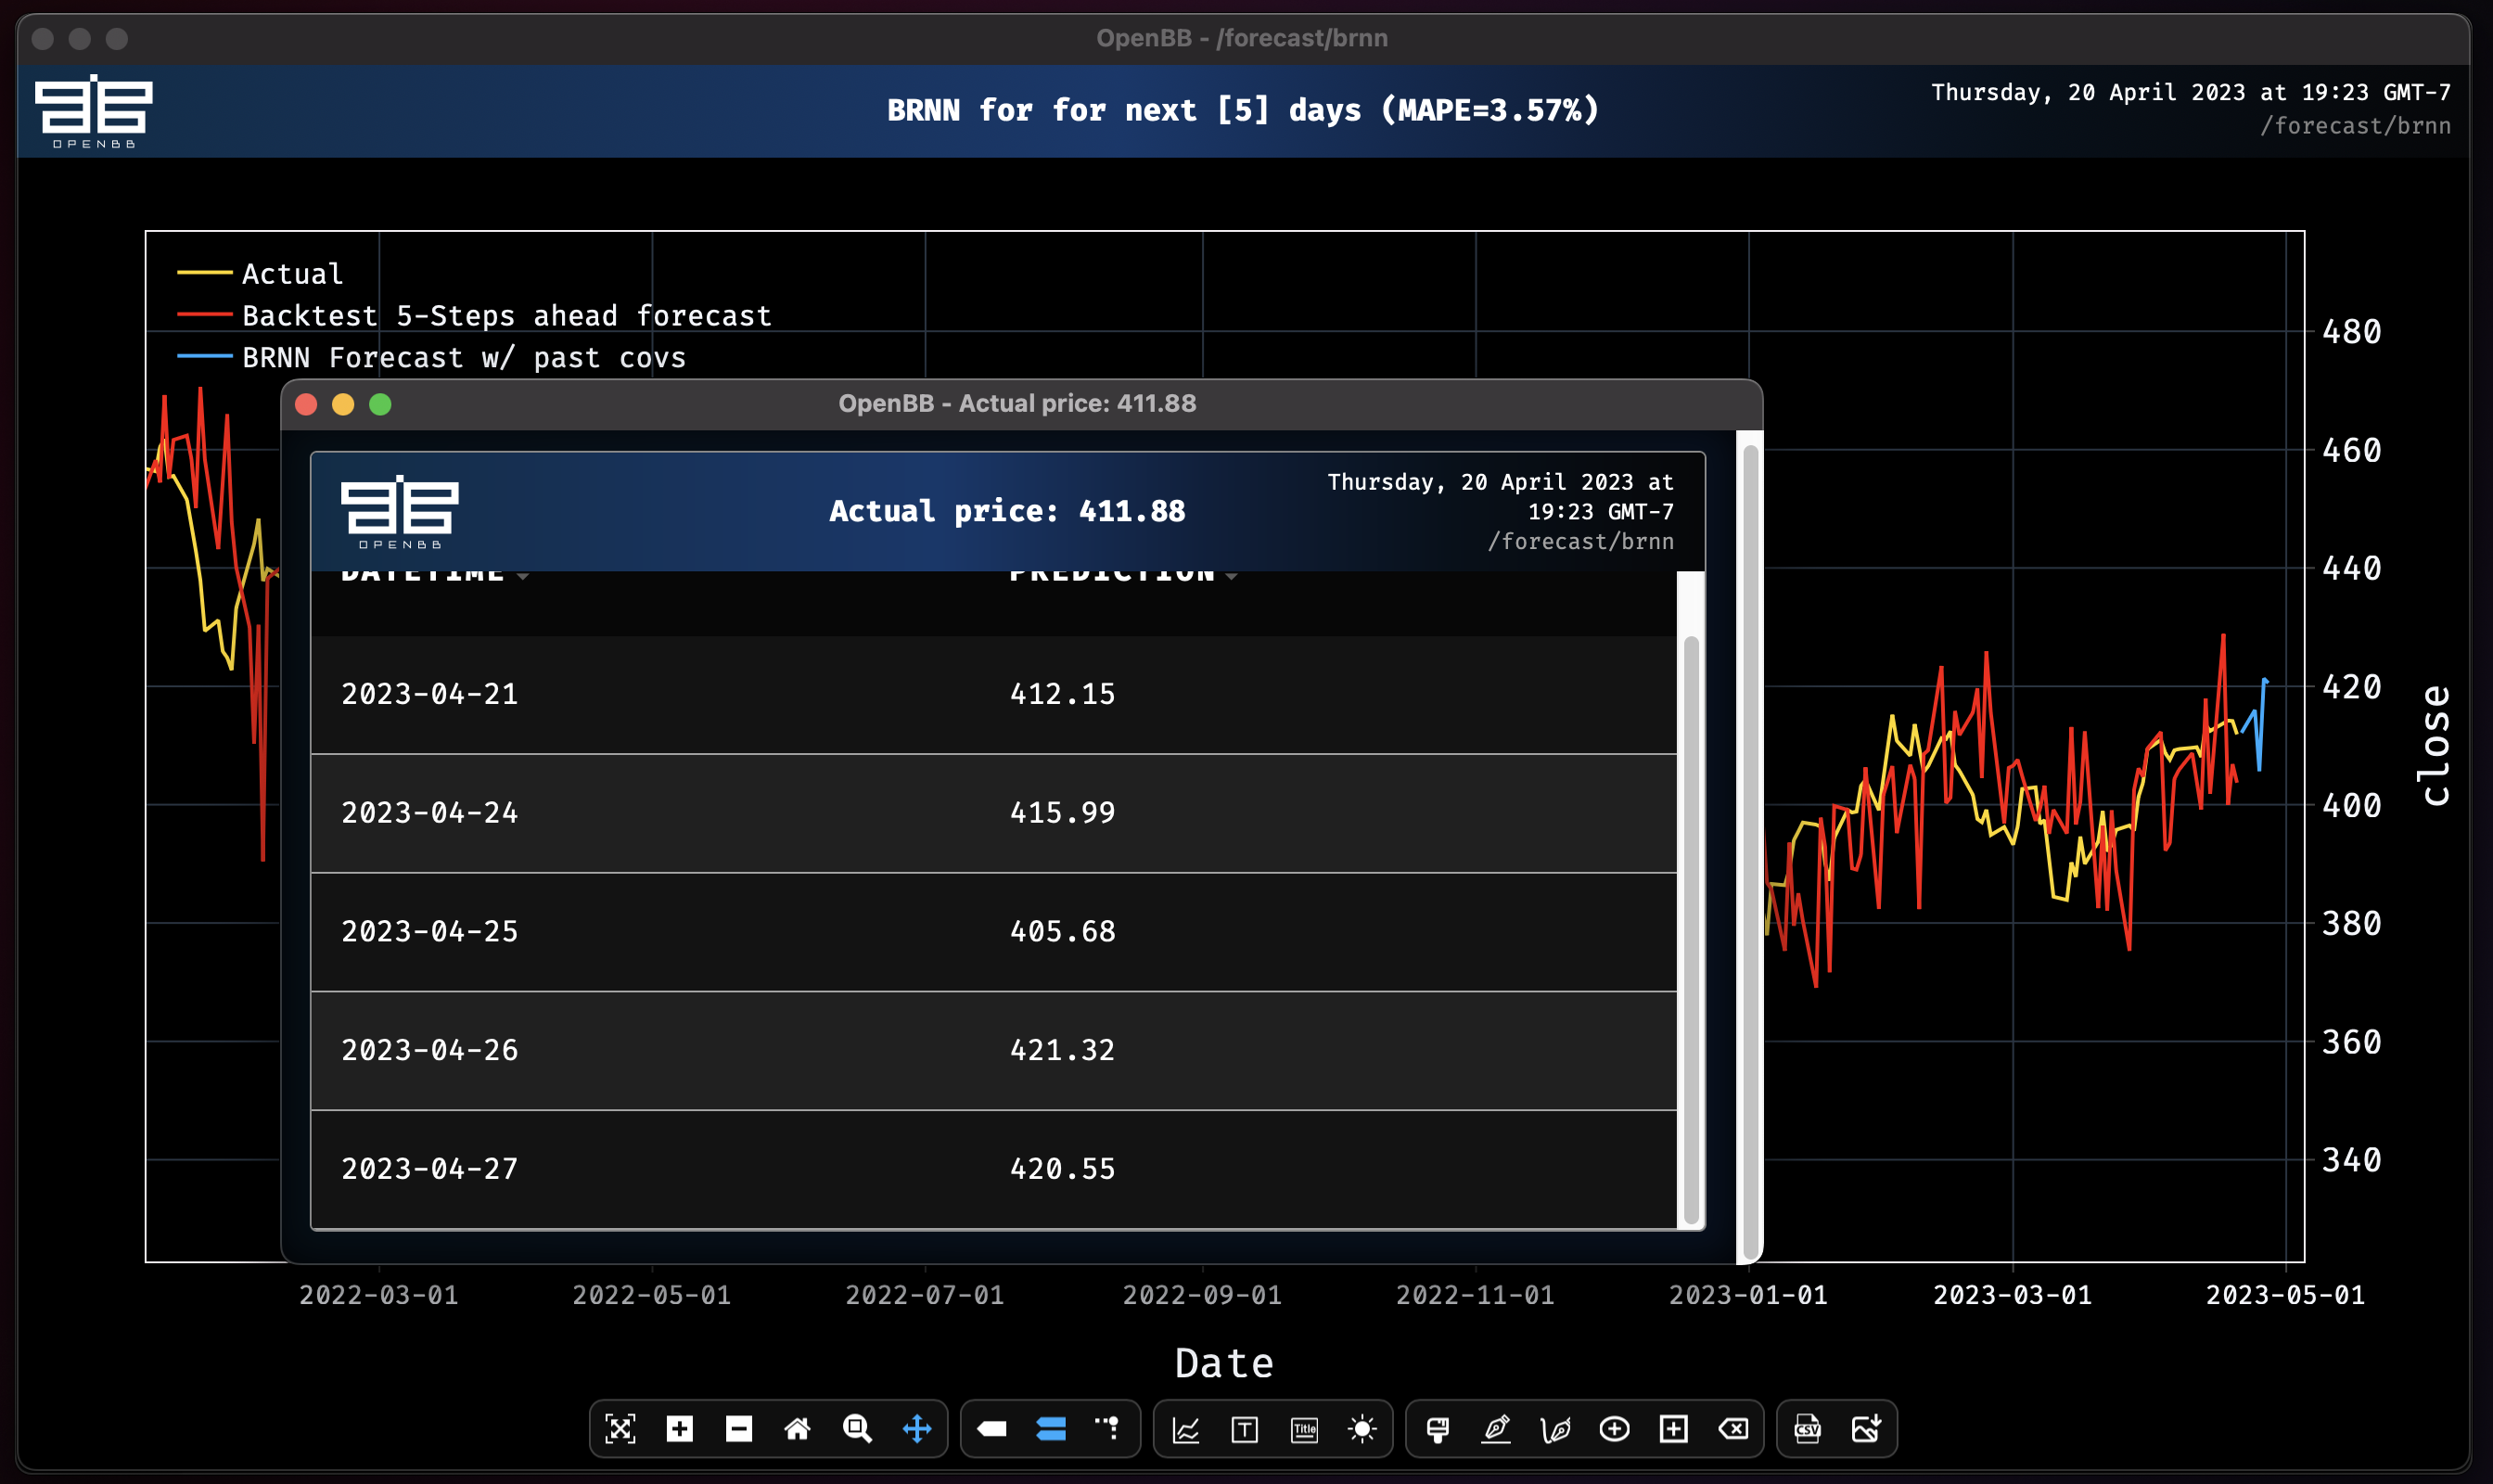
Block RNN model obtains MAPE: 3.57%
|
|
```
|
|
|
|
|
|
|
|
Adding all of the columns that were created doesn't improve the MAPE score, but it does narrow the range of forecasted prices. Playing around like this shows how small changes can have a large impact on a forecast. It is important to test many variables and parameters without getting too caught up overfitting any particular model. Validate a thesis before dedicating a large amount of time into it.
|
|
|
|
### regr
|
|
|
|
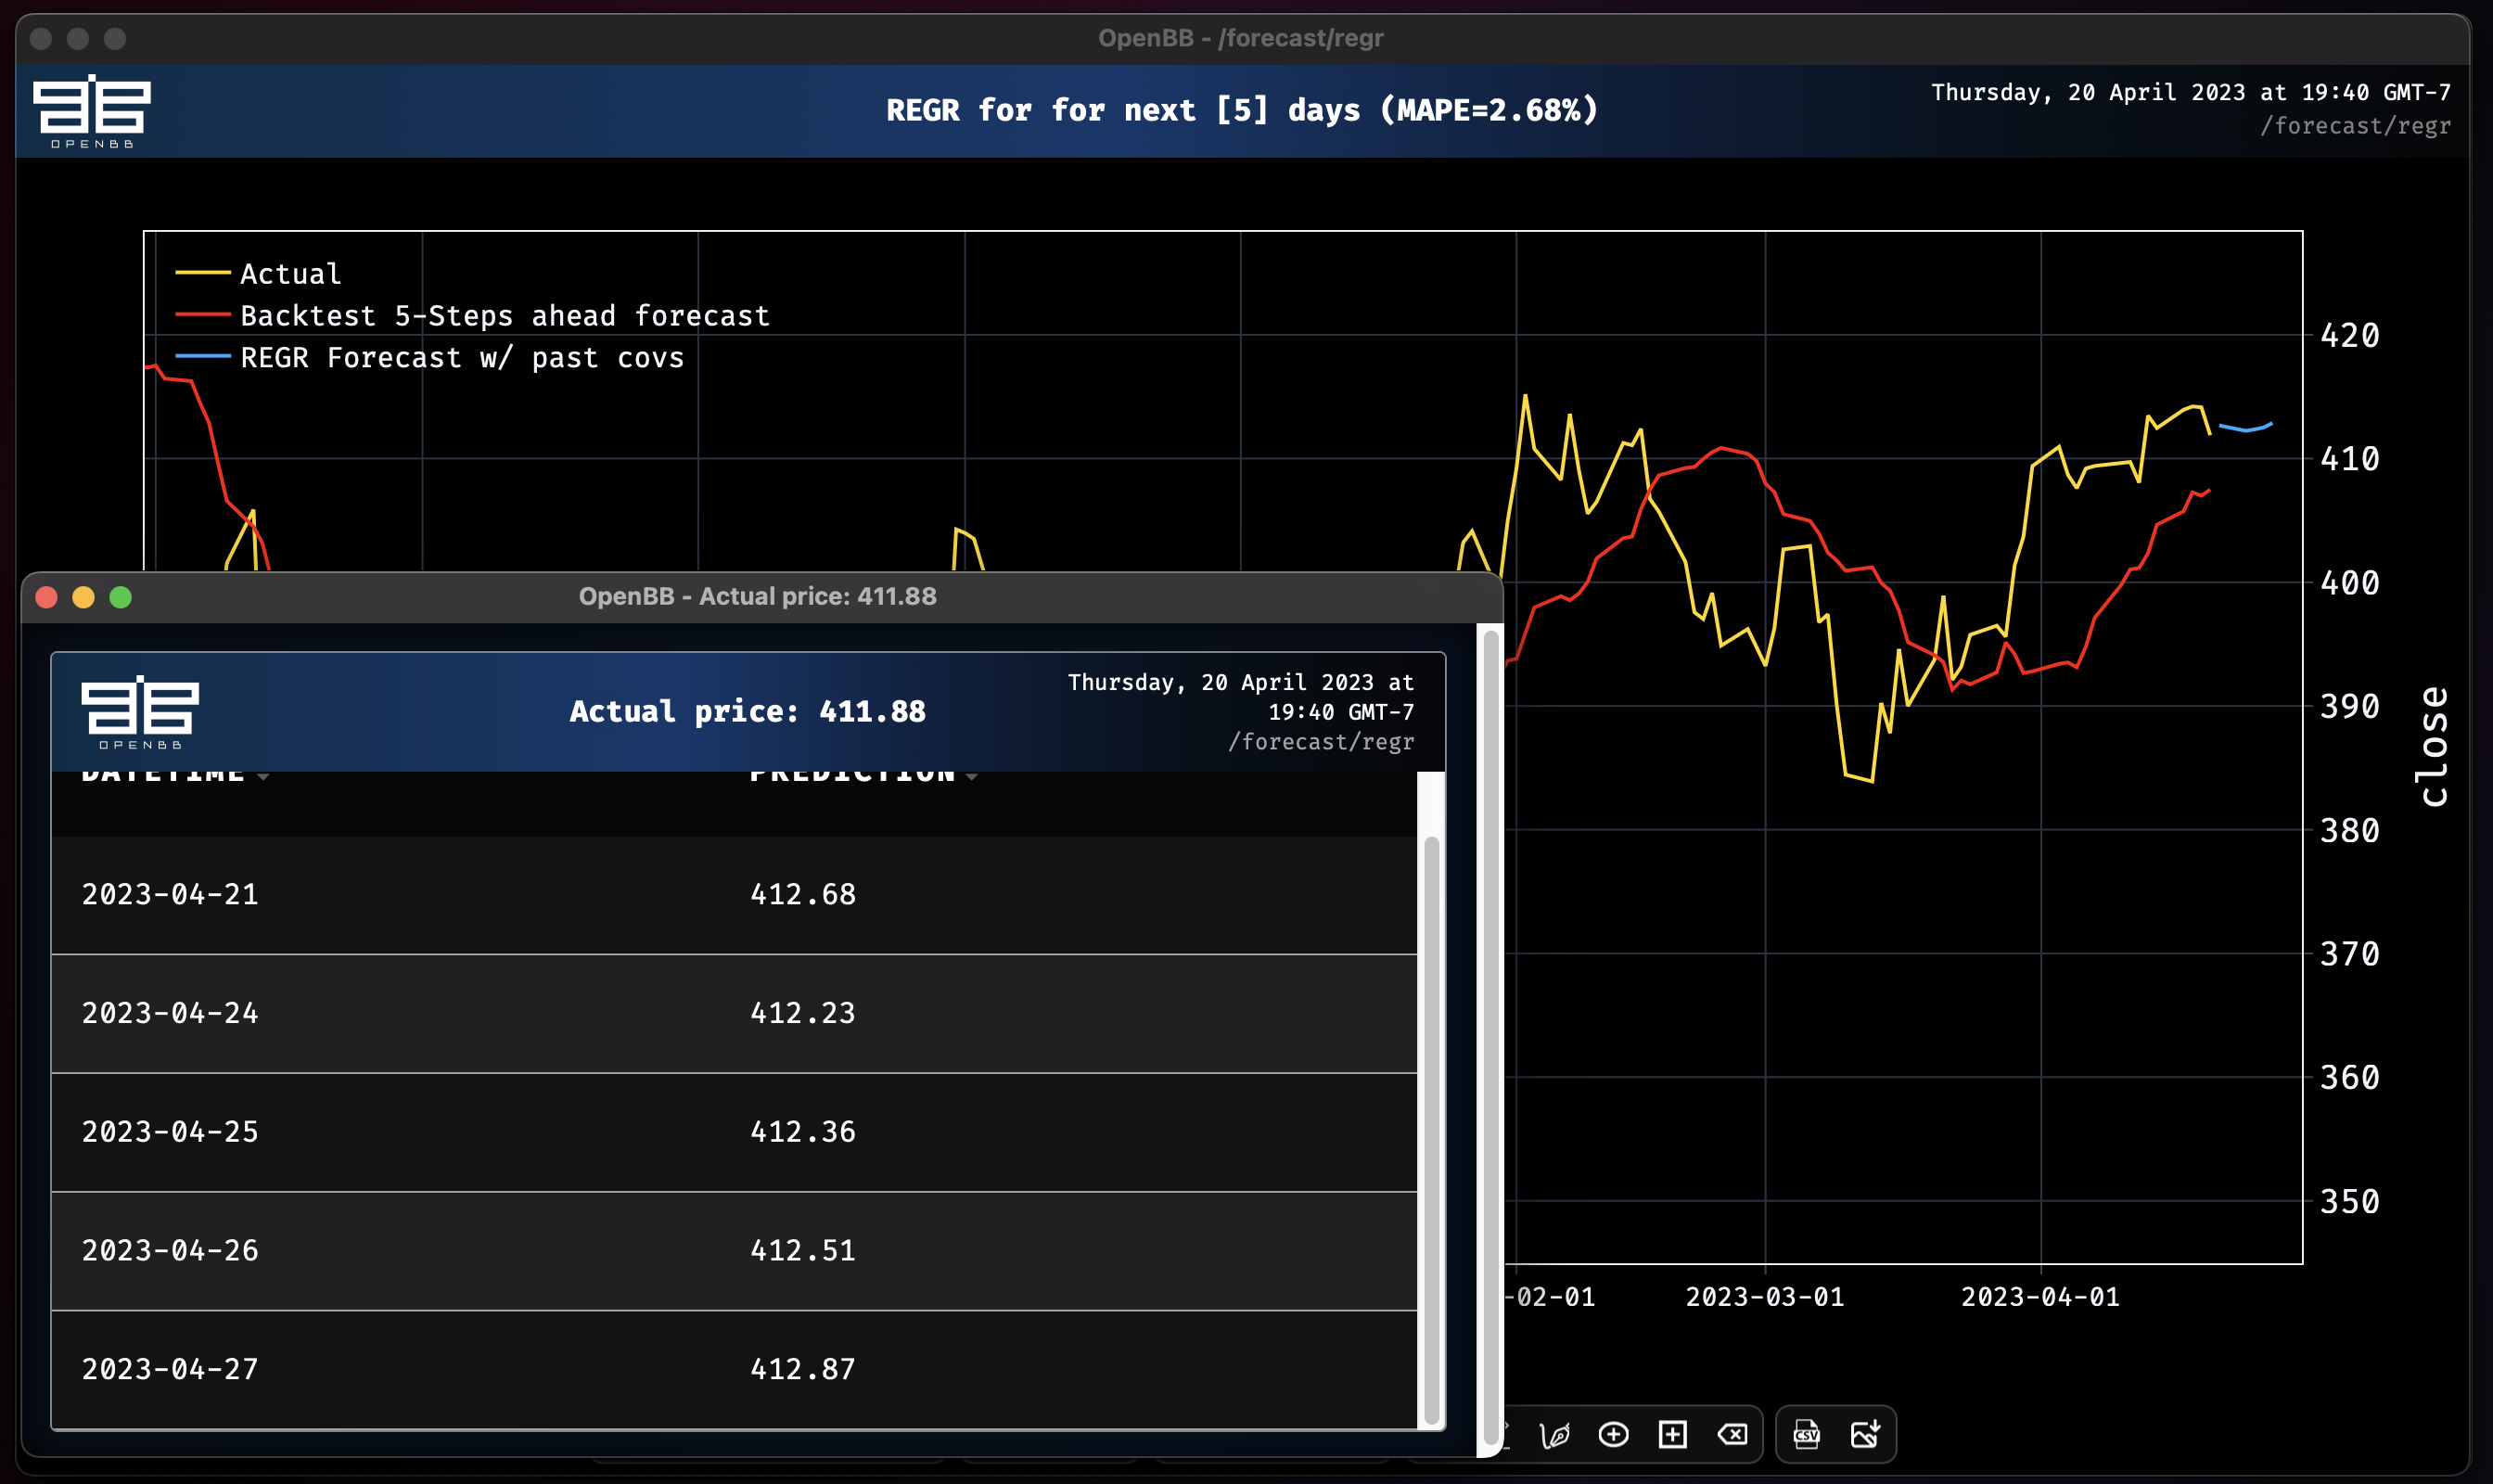
Using the `regr` function with `all-past-covariates` on the same dataset gives dramatically different forecast.
|
|
|
|
```console
|
|
regr SPY --all-past-covariates
|
|
|
|
Covariate #0: open
|
|
Covariate #1: high
|
|
Covariate #2: low
|
|
Covariate #3: volume
|
|
Covariate #4: ^VIX_high
|
|
Covariate #5: ^VIX_low
|
|
Covariate #6: SPY_atr
|
|
Covariate #7: SPY_rsi10
|
|
Predicting Regression for 5 days
|
|
100%|███████████████████████████████████████████████████████████████████████████████████████████████████████| 1026/1026 [00:48<00:00, 21.35it/s]
|
|
Regression model obtains MAPE: 2.68%
|
|
```
|
|
|
|
|
|
|
|
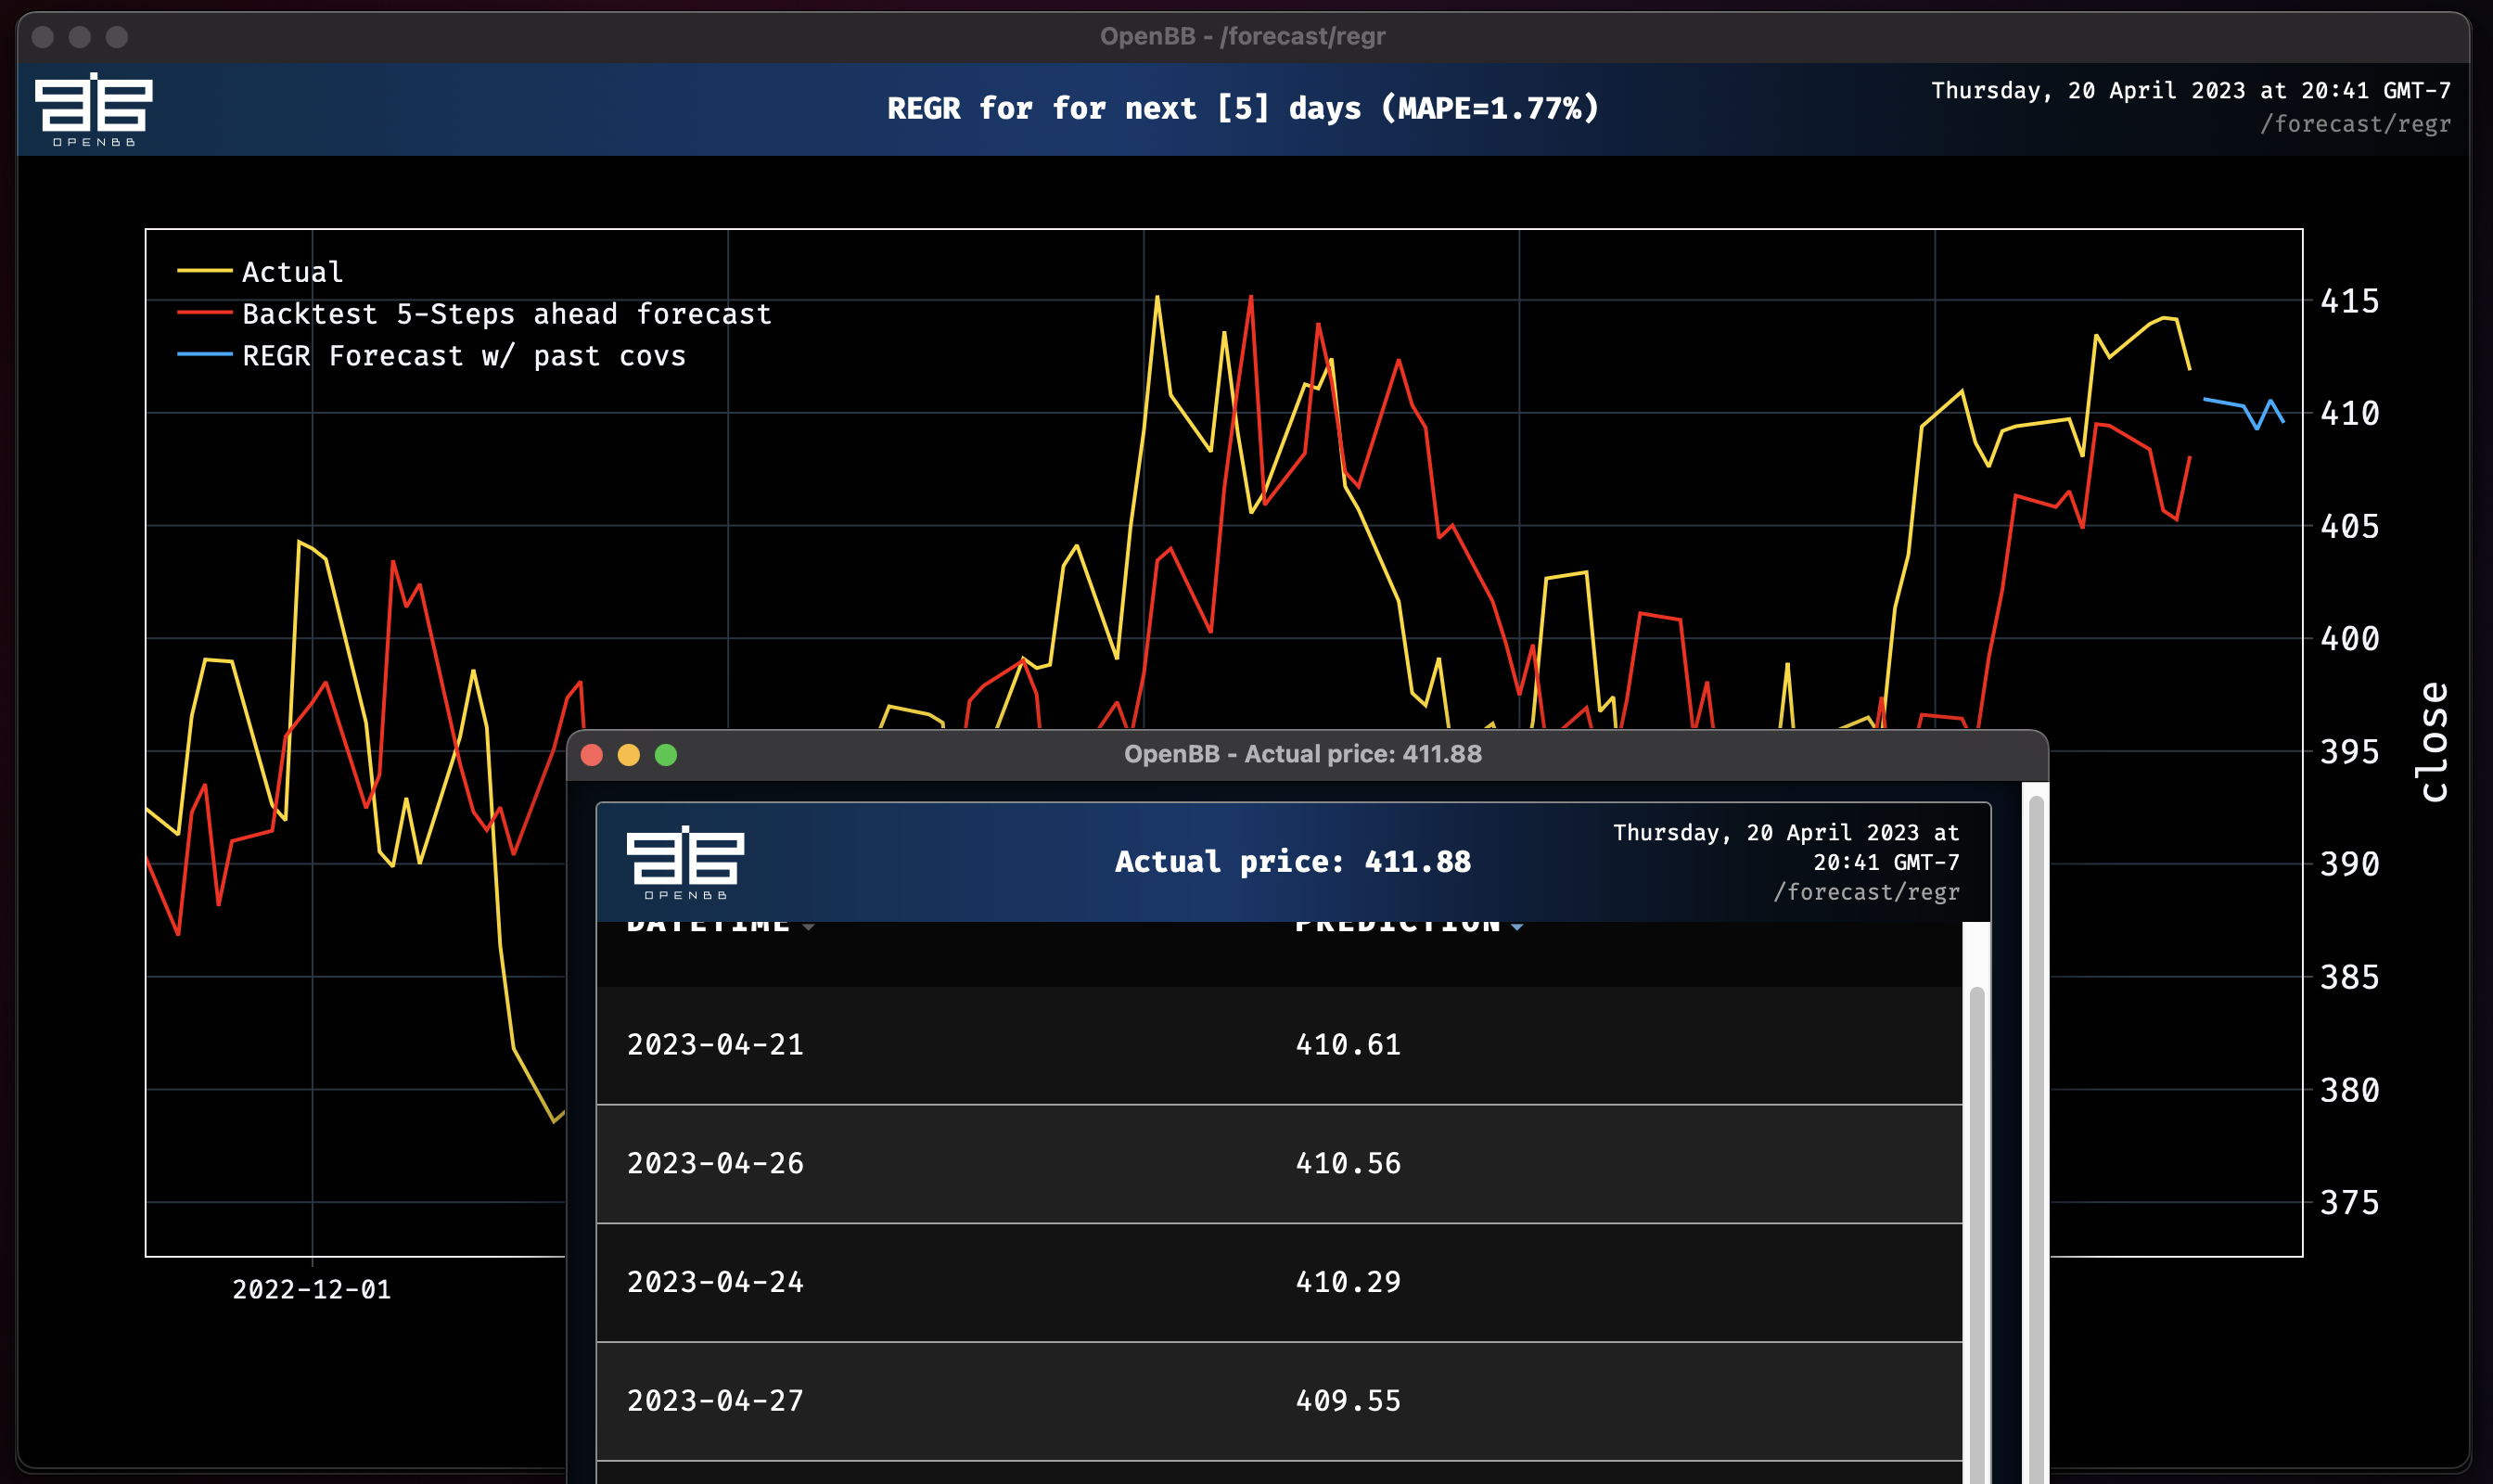
Now that we know how to use covariates, and are starting to understand their effects, let's examine the impact of MSFT and AAPL closing prices on the regression forecast for SPY. We will discard the previous work and start fresh.
|
|
|
|
The cache can be purged by resetting the Terminal. Use this command to clear it:
|
|
|
|
```console
|
|
/r
|
|
```
|
|
|
|
Now we will fetch the data and combine the columns:
|
|
|
|
```console
|
|
/stocks/load spy
|
|
forecast
|
|
..
|
|
load aapl
|
|
forecast
|
|
..
|
|
load msft
|
|
forecast
|
|
delete --delete SPY.stock_splits
|
|
delete --delete SPY.adj_close
|
|
delete --delete SPY.dividends
|
|
combine SPY -c AAPL.close
|
|
combine SPY -c MSFT.close
|
|
regr SPY --forecast-only --past-covariates AAPL_close,MSFT_close
|
|
```
|
|
|
|
**Remember: You can use unlimited number of `past_covariates` but they must all be combined into a single dataframe with the target forecast time series before training.**
|
|
|
|
```console
|
|
Covariate #0: AAPL_close
|
|
Covariate #1: MSFT_close
|
|
Predicting Regression for 5 days
|
|
100%|█████████████████████████████████████████████████████████████████████████████████████████████████████████| 115/115 [00:01<00:00, 96.07it/s]
|
|
Regression model obtains MAPE: 1.77%
|
|
```
|
|
|
|
|
|
|
|
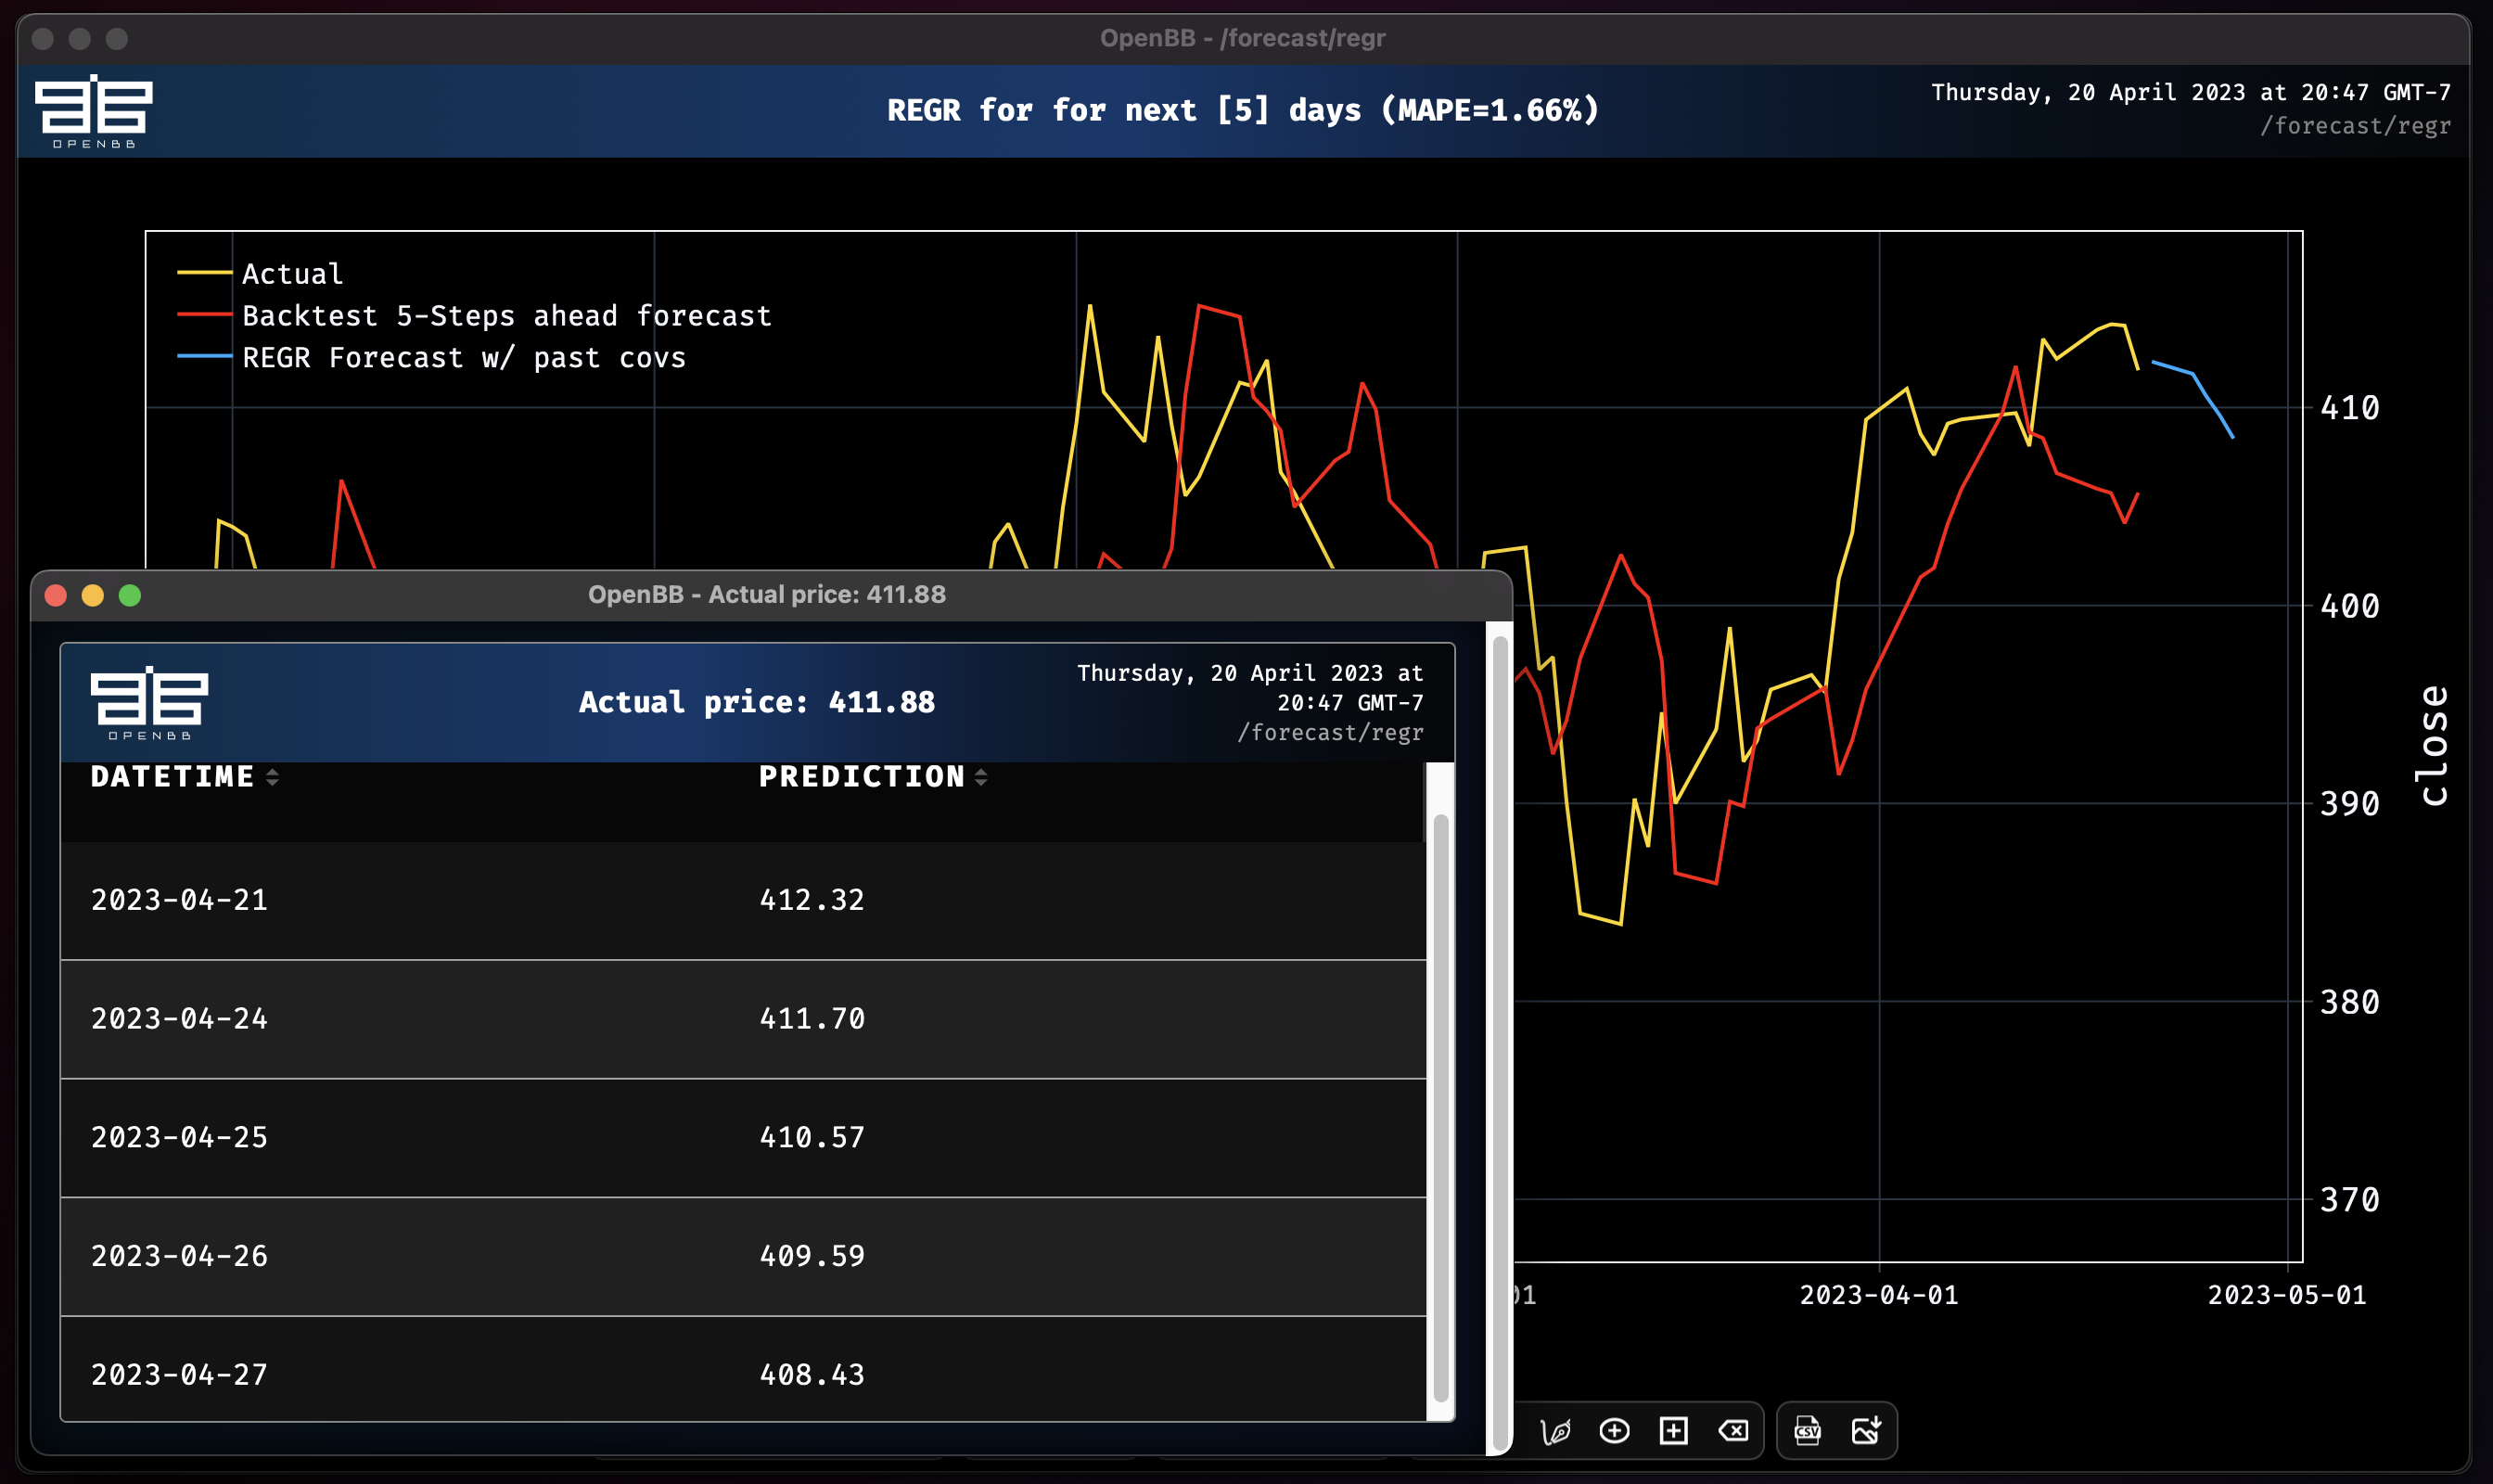
Adding the rest of the columns as past covariates improves the MAPE score slightly and starts to take a more directional view.
|
|
|
|
```console
|
|
regr --all-past-covariates -d SPY
|
|
|
|
Covariate #0: open
|
|
Covariate #1: high
|
|
Covariate #2: low
|
|
Covariate #3: volume
|
|
Covariate #4: AAPL_close
|
|
Covariate #5: MSFT_close
|
|
Predicting Regression for 5 days
|
|
100%|████████████████████████████████████████████████████████████████████████████████████████████████████████| 115/115 [00:00<00:00, 117.16it/s]
|
|
Regression model obtains MAPE: 1.66%
|
|
```
|
|
|
|
|
|
|
|
:::note
|
|
The examples here are over-simplified as a means for demonstrating a framework to create and conduct experiments. It is important to keep in mind that these are tools, they are not oracles, and that results may vary. If you have any questions, requests for new feature engineering and model additions, or just want to be part of the conversation, please join us on [Discord](openbb.co/discord). Happy hacking!
|
|
:::
|