mirror of
https://github.com/OpenBB-finance/OpenBB.git
synced 2026-10-29 13:32:08 +00:00
 4ad995fdd0
* add first iteration of content for Terminal Pro

* Update index.md

* Update dashboards.md

* Update folders.md

* Update grouping.md

* Update report.md

* Update templates.md

* Update quick-start.md

* Update index.md

* Update index.md

* Update home.md

* Update news.md

* Update index.md

* Update index.md

* Update index.md

* Update data-provider.md

* Update chat-with-widget.md

* Update data-manipulation.md

* Update forecasting.md

* fix: images self closing tags

* fix: only pro visitors can see pro

* inter font

* improve SEO content and restructuring

* add new package for toggle on tutorials

* move folder around

* improve main page of each prod

* small updates and improvements

* fix logo above

* small improvement in headtitle for portfolio funcs

* fix typos from OpenAI's GPT-4

* fix _category_ json

* remove generic SEO words

* add script that generates SEO for documentation

* add missing file

* remove sdk warning message

* fix links for andrew

---------

Co-authored-by: jose-donato <zmcdonato@gmail.com>
Co-authored-by: jose-donato <43375532+jose-donato@users.noreply.github.com>
Co-authored-by: andrewkenreich <andrew.kenreich@gmail.com>
79 lines
7.9 KiB
Markdown
Vendored
79 lines
7.9 KiB
Markdown
Vendored
---
|
|
title: plot
|
|
description: This page provides documentation for the 'plot' command used in Python
|
|
scripting. The command is intended for plotting data based on a specified column
|
|
from a dataset with usage examples and parameter explanations.
|
|
keywords:
|
|
- Python scripting
|
|
- data plotting
|
|
- command usage
|
|
- dataset
|
|
- econometrics
|
|
- tutorial
|
|
- SEO optimization
|
|
---
|
|
|
|
import HeadTitle from '@site/src/components/General/HeadTitle.tsx';
|
|
|
|
<HeadTitle title="econometrics /plot - Reference | OpenBB Terminal Docs" />
|
|
|
|
Plot data based on the index
|
|
|
|
### Usage
|
|
|
|
```python
|
|
plot [-v VALUES]
|
|
```
|
|
|
|
---
|
|
|
|
## Parameters
|
|
|
|
| Name | Description | Default | Optional | Choices |
|
|
| ---- | ----------- | ------- | -------- | ------- |
|
|
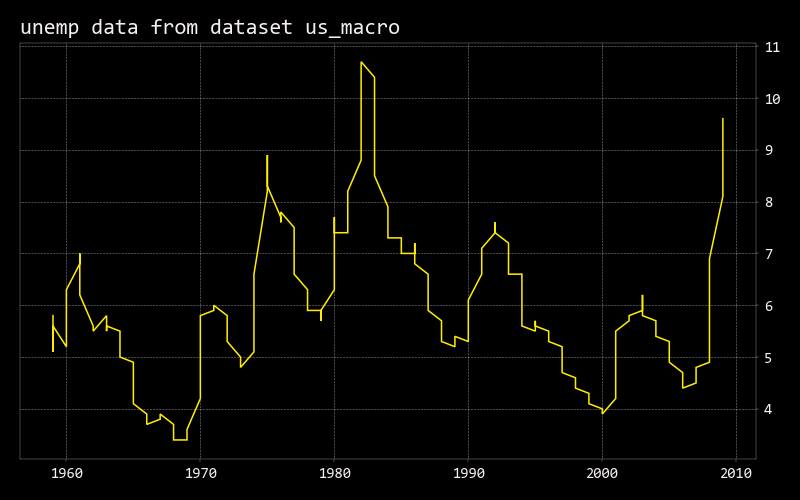
| values | Dataset.column values to be displayed in a plot | None | True | None |
|
|
|
|
|
|
---
|
|
|
|
## Examples
|
|
|
|
```python
|
|
2022 Jun 01, 06:45 (🦋) /econometrics/ $ load macrodata -a us_macro
|
|
|
|
2022 Jun 01, 06:45 (🦋) /econometrics/ $ index us_macro -i year -d
|
|
Successfully updated 'us_macro' index to be 'year'
|
|
|
|
2022 Jun 01, 06:46 (🦋) /econometrics/ $ show us_macro
|
|
|
|
Dataset us_macro | Showing 10 of 203 rows
|
|
┏━━━━━━━━┳━━━━━━━━━┳━━━━━━━━━┳━━━━━━━━━━┳━━━━━━━━━┳━━━━━━━━━━┳━━━━━━━━━┳━━━━━━━┳━━━━━━━━┳━━━━━━━━━━┳━━━━━━━┳━━━━━━━━┳━━━━━━━┳━━━━━━━━━┓
|
|
┃ ┃ quarter ┃ realgdp ┃ realcons ┃ realinv ┃ realgovt ┃ realdpi ┃ cpi ┃ m1 ┃ tbilrate ┃ unemp ┃ pop ┃ infl ┃ realint ┃
|
|
┡━━━━━━━━╇━━━━━━━━━╇━━━━━━━━━╇━━━━━━━━━━╇━━━━━━━━━╇━━━━━━━━━━╇━━━━━━━━━╇━━━━━━━╇━━━━━━━━╇━━━━━━━━━━╇━━━━━━━╇━━━━━━━━╇━━━━━━━╇━━━━━━━━━┩
|
|
│ 1959.0 │ 1.00 │ 2710.35 │ 1707.40 │ 286.90 │ 470.05 │ 1886.90 │ 28.98 │ 139.70 │ 2.82 │ 5.80 │ 177.15 │ 0.00 │ 0.00 │
|
|
├────────┼─────────┼─────────┼──────────┼─────────┼──────────┼─────────┼───────┼────────┼──────────┼───────┼────────┼───────┼─────────┤
|
|
│ 1959.0 │ 2.00 │ 2778.80 │ 1733.70 │ 310.86 │ 481.30 │ 1919.70 │ 29.15 │ 141.70 │ 3.08 │ 5.10 │ 177.83 │ 2.34 │ 0.74 │
|
|
├────────┼─────────┼─────────┼──────────┼─────────┼──────────┼─────────┼───────┼────────┼──────────┼───────┼────────┼───────┼─────────┤
|
|
│ 1959.0 │ 3.00 │ 2775.49 │ 1751.80 │ 289.23 │ 491.26 │ 1916.40 │ 29.35 │ 140.50 │ 3.82 │ 5.30 │ 178.66 │ 2.74 │ 1.09 │
|
|
├────────┼─────────┼─────────┼──────────┼─────────┼──────────┼─────────┼───────┼────────┼──────────┼───────┼────────┼───────┼─────────┤
|
|
│ 1959.0 │ 4.00 │ 2785.20 │ 1753.70 │ 299.36 │ 484.05 │ 1931.30 │ 29.37 │ 140.00 │ 4.33 │ 5.60 │ 179.39 │ 0.27 │ 4.06 │
|
|
├────────┼─────────┼─────────┼──────────┼─────────┼──────────┼─────────┼───────┼────────┼──────────┼───────┼────────┼───────┼─────────┤
|
|
│ 1960.0 │ 1.00 │ 2847.70 │ 1770.50 │ 331.72 │ 462.20 │ 1955.50 │ 29.54 │ 139.60 │ 3.50 │ 5.20 │ 180.01 │ 2.31 │ 1.19 │
|
|
├────────┼─────────┼─────────┼──────────┼─────────┼──────────┼─────────┼───────┼────────┼──────────┼───────┼────────┼───────┼─────────┤
|
|
│ 1960.0 │ 2.00 │ 2834.39 │ 1792.90 │ 298.15 │ 460.40 │ 1966.10 │ 29.55 │ 140.20 │ 2.68 │ 5.20 │ 180.67 │ 0.14 │ 2.55 │
|
|
├────────┼─────────┼─────────┼──────────┼─────────┼──────────┼─────────┼───────┼────────┼──────────┼───────┼────────┼───────┼─────────┤
|
|
│ 1960.0 │ 3.00 │ 2839.02 │ 1785.80 │ 296.38 │ 474.68 │ 1967.80 │ 29.75 │ 140.90 │ 2.36 │ 5.60 │ 181.53 │ 2.70 │ -0.34 │
|
|
├────────┼─────────┼─────────┼──────────┼─────────┼──────────┼─────────┼───────┼────────┼──────────┼───────┼────────┼───────┼─────────┤
|
|
│ 1960.0 │ 4.00 │ 2802.62 │ 1788.20 │ 259.76 │ 476.43 │ 1966.60 │ 29.84 │ 141.10 │ 2.29 │ 6.30 │ 182.29 │ 1.21 │ 1.08 │
|
|
├────────┼─────────┼─────────┼──────────┼─────────┼──────────┼─────────┼───────┼────────┼──────────┼───────┼────────┼───────┼─────────┤
|
|
│ 1961.0 │ 1.00 │ 2819.26 │ 1787.70 │ 266.40 │ 475.85 │ 1984.50 │ 29.81 │ 142.10 │ 2.37 │ 6.80 │ 182.99 │ -0.40 │ 2.77 │
|
|
├────────┼─────────┼─────────┼──────────┼─────────┼──────────┼─────────┼───────┼────────┼──────────┼───────┼────────┼───────┼─────────┤
|
|
│ 1961.0 │ 2.00 │ 2872.01 │ 1814.30 │ 286.25 │ 480.33 │ 2014.40 │ 29.92 │ 142.90 │ 2.29 │ 7.00 │ 183.69 │ 1.47 │ 0.81 │
|
|
└────────┴─────────┴─────────┴──────────┴─────────┴──────────┴─────────┴───────┴────────┴──────────┴───────┴────────┴───────┴─────────┘
|
|
|
|
2022 Jun 01, 06:44 (🦋) /econometrics/ $ plot us_macro.unemp
|
|
```
|
|
|
|
|
|
---
|